Our spark aggregation jobs are taking a lot of execution time to complete. It supposed to complete in 5 mins but taking 30 to 40 minutes to complete.
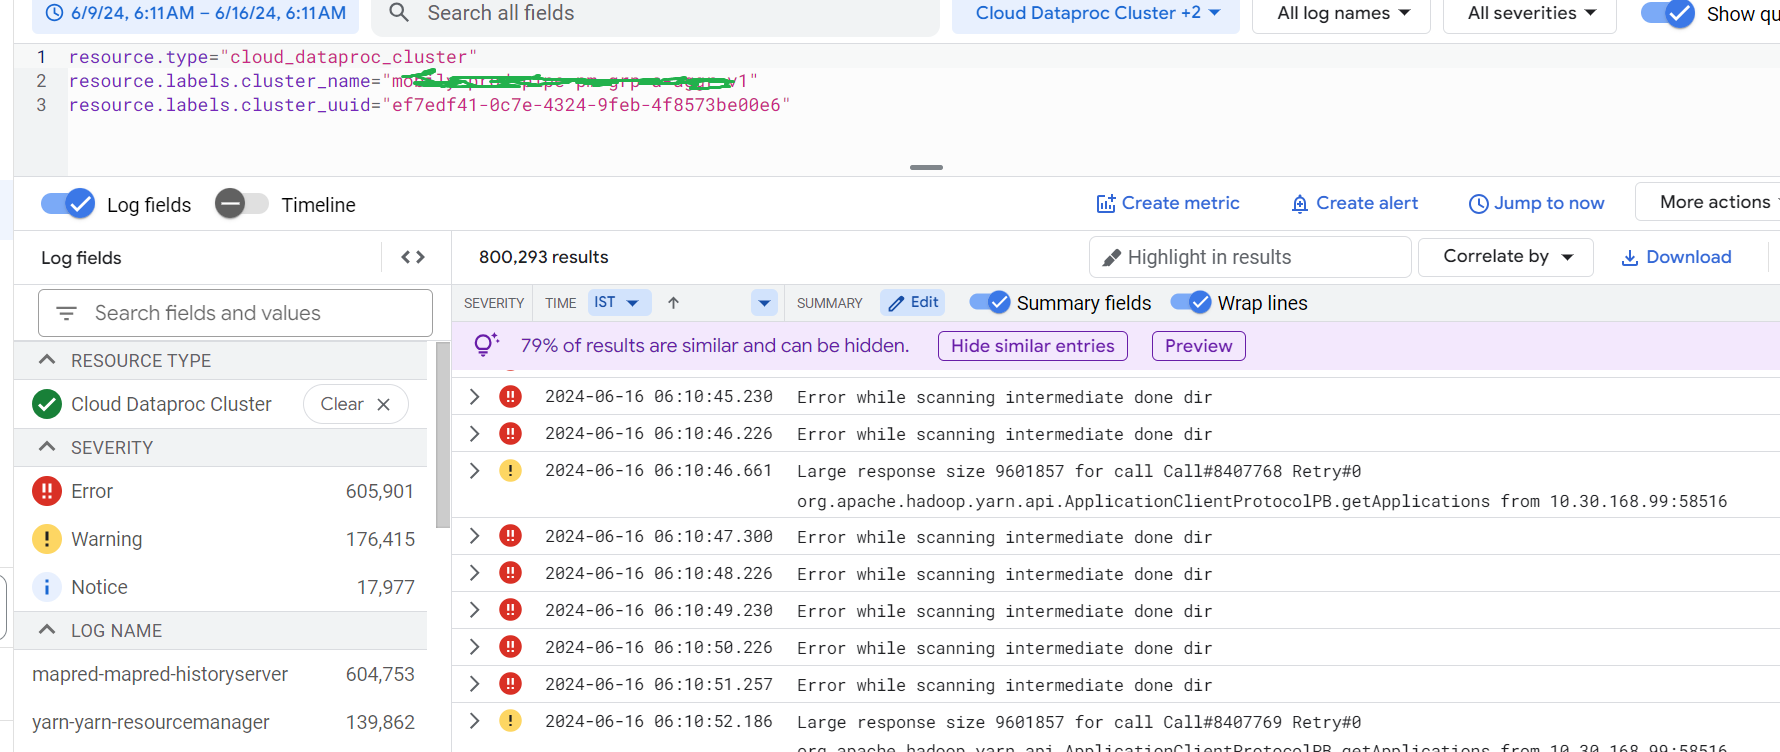
dataproc cluster logging say it's trying to scan the intermediate done dir and its keep on appearing.
If I look at the spark UI, it says that job is actually taking less time only and it may be hold up because of something.
I tried to look at the yarn logs for a given job id, but I could not find the similar error message there. Where I can see the same log which appearing on cloud logging?
yarn logs -applicationId application_1700468925211_1632269
I read some articles which says it has something to do with jobhistory server wherein it trying to scan the directory in loop.
for reference: https://issues.apache.org/jira/browse/MAPREDUCE-6684
Having a look at mapred-site.xml file I found below properties which are pointing to gcs bucket location of a temp bucket to store dataproc jobs details.
mapreduce.jobhistory.done-dir
mapreduce.jobhistory.intermediate-done-dir

<property>
    <name>mapreduce.jobhistory.always-scan-user-dir</name>
    <value>true</value>
    <description>Enable history server to always scan user dir.</description>
</property>


<property>
        <name>mapreduce.jobhistory.recovery.enable</name>
        <value>true</value>
        <description>
            Enable history server to recover server state on startup.
        </description>
    </property>
Can we disable above to false in order to resolve the problem. I am very skeptical about the approach since we are facing this issue in production and cannot be replicated at lower environment. Looking forward for meaningful suggestions.

