how to debug with xUnit?
Asked Answered
U

11

54

I'm learning xUnit and so far, have found it to be a most useful tool. It's making me rethink some of my coding tactics to TDD instead.

However, I've come across an interesting problem. My test case is failing. No real concern there, but how do I debug it?

Specifically my test case is failing due to a "out of index" error, or something similar. It's NOT failing at the assert statement. What I need now, is some way to run the test case with the Visual Studio debugger active so that I can see the status of the different variables.

I'm not going to post code, as this situation is bound to come up again. Does anyone have any idea HOW to debug the test case itself?

Almost forgot! I'm using,

  • Visual Studio 2010 Ultimate (Dreamspark license)
  • xUnit 1.9

My workflow involves using the xUnit GUI runner to run the tests.

If what I'm asking is impossible, can someone suggest an alternative test suite I could use that has what I want?

Urethritis answered 26/6, 2012 at 10:45 Comment(3)
Actually, if you are to debug unit test, it's a bad unit test. Tests should be designed as simple and straightforward as possible, so you can verify it's correctness by barely looking at them. Consider rewriting this test.Giddy
@J0HN, the error in question came from the code I was testing, NOT the unit test. My problem was in finding WHY it was occurring. xUnit helpfully tells me that line XX produced exception YYY, but it doesn't tell me anything else. Like what was the state of the variables when the exception occurred (or the like)?Urethritis
@Giddy there are cases when the unit test is not bad per se; I just had an example which was very difficult to discover because of cognitive dissonance ~~ caveat, this occurred very early in the development of a project and was related to a numeric literal in the SUT that had transposed digits; in this case the unit test + debug collaborated to help me make the SUT more robust.Tracheostomy
S
11

I've not tested this but you should be able to attach visual studio to the xUnit GUI and debug from there.

From the Debug menu select 'attach to process', locate the name of the executable in the list and click attach. Set breakpoints in the unit test as required and run the test from the GUI. The breakpoint should be hit as expected.

Semipalmate answered 26/6, 2012 at 10:49 Comment(2)
With NUnit, you can set the GUI as the program to start when debugging and pass the assembly name as an argument. Hitting F5 will then launch the NUnit GUI under the debugger with the correct assembly. I'm assuming that you can do something similar with xUnit.Proton
@Proton Thank you VERY much for that idea! Never really occurred to me. Some twiddling around with the "debug" properties and I got the xUnit GUI runner to start up when I run debug AND with variable info too!! :)Urethritis
G
87

In VS2015 and later, install the xunit.runner.visualstudio NuGet package. Then debugging is as easy as right-clicking on the test in the test explorer window. (Test-->Windows-->TestExplorer if you can't see it). You can also right-click anywhere in the code of the test and Run Test and Debug Test will be in the context menu. If your test is not showing up, be sure the class and method are both public.

enter image description here

Gegenschein answered 26/5, 2016 at 7:42 Comment(2)
+1 @user1585345 thank you ... i'd forgotten the "when in doubt, right-click" mantra; your suggestion is a wonderful way to quickly debug a single failing test should that be necessary.Tracheostomy
I have tried this, but I keep getting TestClass.cs not found.Misbelief
S
11

I've not tested this but you should be able to attach visual studio to the xUnit GUI and debug from there.

From the Debug menu select 'attach to process', locate the name of the executable in the list and click attach. Set breakpoints in the unit test as required and run the test from the GUI. The breakpoint should be hit as expected.

Semipalmate answered 26/6, 2012 at 10:49 Comment(2)
With NUnit, you can set the GUI as the program to start when debugging and pass the assembly name as an argument. Hitting F5 will then launch the NUnit GUI under the debugger with the correct assembly. I'm assuming that you can do something similar with xUnit.Proton
@Proton Thank you VERY much for that idea! Never really occurred to me. Some twiddling around with the "debug" properties and I got the xUnit GUI runner to start up when I run debug AND with variable info too!! :)Urethritis
J
11

I have failed in implementing all of the above, but the following worked for me: Before the lines where you want to debug add the following line (then run the test):

        System.Diagnostics.Debugger.Launch();

The drawback is that it will launch another instance of VS :).

Cheers!

Juba answered 29/1, 2015 at 14:11 Comment(1)
This is unfortunately seems the only way to debug dnx test in released VS 2015Bavaria
G
7

In visual studio 2017, make sure that solution configuration is under 'Debug' mode. Under 'Release' mode it is not debugging.

Gamba answered 28/11, 2017 at 12:37 Comment(0)
B
6

The following will work in VS.NET and in SharpDevelop.

Open the test project's properties and go to Debug tab:

  • Under "Start Action" set "Start external program" to the xUnit runner executable of choice.

  • Under "Start Options" set "Command line arguments" to the name of your project's debug DLL.

  • Also set "Working directory" to the project's "bin\Debug\" directory.

Then select Debug > Run or press F5 to run your test in debug mode. Breakpoints will be hit.

The advantage of doing your debugging this way is you don't have to attach to the xUnit GUI each time, you just need to run your test project.

Bonnard answered 17/1, 2013 at 10:28 Comment(0)
C
6

See the answer to this question: Stepping through and debugging code in Unit tests .

Essentially:

...go to 'Test' in the main menu of VS..., click submenu 'Debug' . . .'.

It also works for me using VS2017 ;)

Collegiate answered 12/4, 2019 at 8:17 Comment(0)
M
5

Update for 2020: If you're using Visual Studio Code with OmniSharp, you can click the "Debug Test" text above the method.

Visual Studio Code with OmniSharp and xUnit

Mameluke answered 6/8, 2020 at 2:18 Comment(3)
Is this a cyberpunk theme? Looks pretty neatMarcoux
@VinShahrdar It's Synthwave x FluoromachineMameluke
Is there a way to debug all tests in all classes of a test project?Unbearable
S
2

If you have resharper, with X-unit contrib extension installed (seriously recommended!), right click the class in visual studio and click "debug unit tests".

Simple!

Shelly answered 15/7, 2014 at 9:51 Comment(2)
As long as you don't use the extension for ReSharper that should support xUnit2, then debugging is a pain in the.... github.com/xunit/resharper-xunit/issues/9Murmur
+1 @Adam Diment ... thank you ... i'm using vs2015 Enterprise with JetBrains ReSharper Ultimate so I'm not sure whether this feature is from ReSharper or now native to vs2015; regardless, on right-click the class name of my xUnit.net test class, because of your guidance, i found "Debug Tests" (ctrl+r, ctrl+t) ... your suggestion helped me discover the reason my test was failing (specially a typo regarding a literal to which i'd been blinded). B-)Tracheostomy
P
1
  1. set a break point inside of your method.
  2. from visual studio Menu bar, click on Test.
  3. from Debug click on Selected Test or All Test.
Parian answered 26/12, 2018 at 6:51 Comment(0)
Z
0

I tried all of the above and had no success. The thing that worked for me is from the following post: https://github.com/OmniSharp/omnisharp-vscode/issues/1630#issuecomment-317797607

In the .csproj file, under PropertyGroup add the following: portable

Zareba answered 1/6, 2021 at 14:47 Comment(0)
C
0

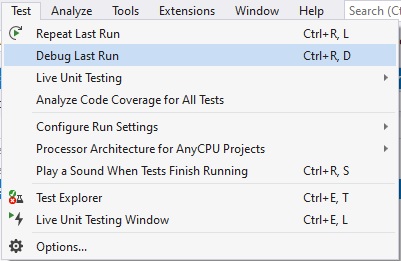
Here's what I did, I just set the breakpoints, and from the menu from the top I choose "Test > Debug All Tests" or "Test > Debug last run"

enter image description here

Chicory answered 24/8, 2022 at 7:45 Comment(0)

© 2022 - 2024 — McMap. All rights reserved.