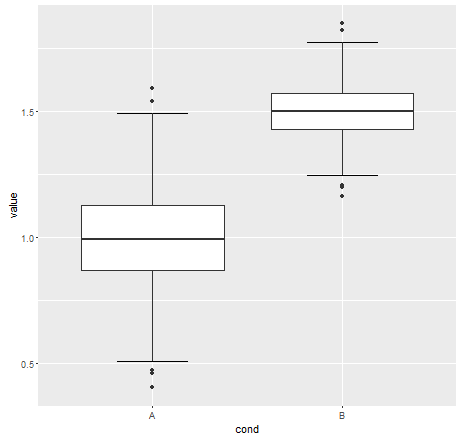
I would like to put perpendicular lines at the ends of the whiskers like the boxplot function automatically gives.
As hinted but not implemented by @Roland, you can use stat_boxplot to implement this. The trick calling _boxplot twice and is to set the geom to errorbar for one of the calls.
Note that as R uses a pen and paper approach it is advisable to implement the error bars first the draw the traditional boxplot over the top.
Using @Roland's dummy data df
ggplot(df, aes(x=cond, y = value))  +
 stat_boxplot(geom ='errorbar') +
 geom_boxplot() # shorthand for  stat_boxplot(geom='boxplot')

The help for stat_boxplot (?stat_boxplot) detail the various values computed and saved in a data.frame
geom_boxplot(width=.2) ? –
Malo stat_params = list(width = 0.5) inside the function: stat_boxplot. See the result in my answer. –
Stirps geom_boxplot(width = 0.2) + stat_boxplot(geom = "errorbar", width = 0.2), where the values selected in the boxplot and in the error bars must match. For whiskers that span half the box, you would set width = 0.2 and width = 0.1. –
Arteriotomy To resize the whiskers lines we can use the argument width = 0.5 inside the function: stat_boxplot
set.seed(42)
df <- data.frame(cond = factor(rep(c("A", "B"), each = 500)),
                 value = c(rnorm(500, mean = 1, sd = 0.2),
                           rnorm(500, mean = 1.5, sd = 0.1)))

library(ggplot2)
ggplot(df, aes(x = cond, y = value)) +
       stat_boxplot(geom = "errorbar", width = 0.5) +
       geom_boxplot()
Error: Unknown parameters: stat_params. What version of R are you using? –
Commingle stat_params . Now it should work. –
Stirps stat_boxplot(geom = 'errorbar') + geom_boxplot(inherit.aes = TRUE) –
Ellingson inherit.aes is TRUE, so geom_boxplot(inherit.aes = TRUE) and geom_boxplot() are identical. –
Stirps It might be possible to use stat_boxplot to calculate the whisker ends, but I am not enough of a ggplot2 wizard, so I use the base function for that.
set.seed(42)
df <- data.frame(cond = factor( rep(c("A","B"), each=500) ),
                 value = c(rnorm(500,mean=1,sd=0.2),rnorm(500, mean=1.5,sd=0.1)))


whisk <- function(df,cond_col=1,val_col=2) {
  require(reshape2)
  condname <- names(df)[cond_col]
  names(df)[cond_col] <- "cond"
  names(df)[val_col] <- "value"
  b <- boxplot(value~cond,data=df,plot=FALSE)
  df2 <- cbind(as.data.frame(b$stats),c("min","lq","m","uq","max"))
  names(df2) <- c(levels(df$cond),"pos")
  df2 <- melt(df2,id="pos",variable.name="cond")
  df2 <- dcast(df2,cond~pos)
  names(df2)[1] <- condname
  df2
}


library(ggplot2)

plot1 <- ggplot(df, aes(x=cond))
plot1 <- plot1 + geom_errorbar(aes(ymin=min,ymax=max),data=whisk(df),width = 0.5)
plot1 <- plot1 + geom_boxplot(aes(y=value))
plot1

In the latest version of ggplot2 v3.5.0 we can now use the staplewidth argument in geom_boxplot to add some whiskers to the ends. According to the documentation:
The relative width of staples to the width of the box. Staples mark the ends of the whiskers with a line.
So with staplewidth of 0 we don't have whiskers. Here is some reproducible example:
# Install latest version
# install.packages("ggplot2")
library(ggplot2)
ggplot(iris, aes(x=Species, y = Sepal.Length))  +
  geom_boxplot(staplewidth = 1)

Created on 2024-02-27 with reprex v2.0.2
© 2022 - 2024 — McMap. All rights reserved.


geom_segmentorgeom_crossbar. see this question – Aricaarickboxplotwhich already does what you want, or is this question of purely academic interest...? – Dawson