How can I make consistent-width plots in ggplot (with legends)?
Asked Answered
S

7

62

I've got a few different categories that I want to plot. These are different categories, each with their own set of labels, but which makes sense to group together in the document. The following gives some simple stacked bar chart examples:

df <- data.frame(x=c("a", "b", "c"),
                 y=c("happy", "sad", "ambivalent about life"))
ggplot(df, aes(x=factor(0), fill=x)) + geom_bar()
ggplot(df, aes(x=factor(0), fill=y)) + geom_bar()

The problem is that with different labels, the legends have different widths, which means the plots have different widths, leading to things looking a bit goofy if I make a table or \subfigure elements. How can I fix this?

Is there a way to explicitly set the width (absolute or relative) of either the plot or the legend?

Chart 1 based on x (wider) Chart 2 based on y (narrower)

Syphon answered 27/4, 2013 at 18:36 Comment(2)
another alternative: you could probably place the legends at the top/bottom/inside the plot?Trisaccharide
+ theme(legend.position = "top") (or "bottom") (or) + theme(legend.position=c(1,0), legend.justification=c(1,0))Trisaccharide
B
49

Edit: Very easy with egg package

# install.packages("egg")

library(egg)

p1 <- ggplot(data.frame(x=c("a","b","c"),
                        y=c("happy","sad","ambivalent about life")),
             aes(x=factor(0),fill=x)) + 
      geom_bar()
p2 <- ggplot(data.frame(x=c("a","b","c"),
                        y=c("happy","sad","ambivalent about life")),
             aes(x=factor(0),fill=y)) + 
      geom_bar()

ggarrange(p1,p2, ncol = 1)

Original Udated to ggplot2 2.2.1

Here's a solution that uses functions from the gtable package, and focuses on the widths of the legend boxes. (A more general solution can be found here.)

library(ggplot2)   
library(gtable)    
library(grid)
library(gridExtra) 

# Your plots
p1 <- ggplot(data.frame(x=c("a","b","c"),y=c("happy","sad","ambivalent about life")),aes(x=factor(0),fill=x)) + geom_bar()
p2 <- ggplot(data.frame(x=c("a","b","c"),y=c("happy","sad","ambivalent about life")),aes(x=factor(0),fill=y)) + geom_bar()

# Get the gtables
gA <- ggplotGrob(p1)
gB <- ggplotGrob(p2)

# Set the widths
gA$widths <- gB$widths

# Arrange the two charts.
# The legend boxes are centered
grid.newpage()
grid.arrange(gA, gB, nrow = 2)

If in addition, the legend boxes need to be left justified, and borrowing some code from here written by @Julius

p1 <- ggplot(data.frame(x=c("a","b","c"),y=c("happy","sad","ambivalent about life")),aes(x=factor(0),fill=x)) + geom_bar()
p2 <- ggplot(data.frame(x=c("a","b","c"),y=c("happy","sad","ambivalent about life")),aes(x=factor(0),fill=y)) + geom_bar()

# Get the widths
gA <- ggplotGrob(p1)
gB <- ggplotGrob(p2)

# The parts that differs in width
leg1 <- convertX(sum(with(gA$grobs[[15]], grobs[[1]]$widths)), "mm")
leg2 <- convertX(sum(with(gB$grobs[[15]], grobs[[1]]$widths)), "mm")

# Set the widths
gA$widths <- gB$widths

# Add an empty column of "abs(diff(widths)) mm" width on the right of 
# legend box for gA (the smaller legend box)
gA$grobs[[15]] <- gtable_add_cols(gA$grobs[[15]], unit(abs(diff(c(leg1, leg2))), "mm"))

# Arrange the two charts
grid.newpage()
grid.arrange(gA, gB, nrow = 2)

enter image description here

Alternative solutions There are rbind and cbind functions in the gtable package for combining grobs into one grob. For the charts here, the widths should be set using size = "max", but the CRAN version of gtable throws an error.

One option: It should be obvious that the legend in the second plot is wider. Therefore, use the size = "last" option.

# Get the grobs
gA <- ggplotGrob(p1)
gB <- ggplotGrob(p2)

# Combine the plots
g = rbind(gA, gB, size = "last")

# Draw it
grid.newpage()
grid.draw(g)

Left-aligned legends:

# Get the grobs
gA <- ggplotGrob(p1)
gB <- ggplotGrob(p2)

# The parts that differs in width
leg1 <- convertX(sum(with(gA$grobs[[15]], grobs[[1]]$widths)), "mm")
leg2 <- convertX(sum(with(gB$grobs[[15]], grobs[[1]]$widths)), "mm")

# Add an empty column of "abs(diff(widths)) mm" width on the right of 
# legend box for gA (the smaller legend box)
gA$grobs[[15]] <- gtable_add_cols(gA$grobs[[15]], unit(abs(diff(c(leg1, leg2))), "mm"))

# Combine the plots
g = rbind(gA, gB, size = "last")

# Draw it
grid.newpage()
grid.draw(g)

A second option is to use rbind from Baptiste's gridExtra package

# Get the grobs
gA <- ggplotGrob(p1)
gB <- ggplotGrob(p2)

# Combine the plots
g = gridExtra::rbind.gtable(gA, gB, size = "max")

# Draw it
grid.newpage()
grid.draw(g)

Left-aligned legends:

# Get the grobs
gA <- ggplotGrob(p1)
gB <- ggplotGrob(p2)

# The parts that differs in width
leg1 <- convertX(sum(with(gA$grobs[[15]], grobs[[1]]$widths)), "mm")
leg2 <- convertX(sum(with(gB$grobs[[15]], grobs[[1]]$widths)), "mm")

# Add an empty column of "abs(diff(widths)) mm" width on the right of 
# legend box for gA (the smaller legend box)
gA$grobs[[15]] <- gtable_add_cols(gA$grobs[[15]], unit(abs(diff(c(leg1, leg2))), "mm"))

# Combine the plots
g = gridExtra::rbind.gtable(gA, gB, size = "max")

# Draw it
grid.newpage()
grid.draw(g)
Beckybecloud answered 28/4, 2013 at 0:40 Comment(7)
That's excellent! Are these functions and variables documented anywhere or did you just look through the ggplot source?Syphon
@Syphon There is the gtable manual on CRAN, but other than that, it's a matter of taking note of others' examples on SO and sometimes on the ggplot mailing list.Beckybecloud
Did you try rbind()ing the plots together? That should just work, but I can't remember if we finished that code.Backwoodsman
I seem to run into the issue @baptiste mentions with units when using rbindSyphon
Is this method still the best way to align legend boxes or are there any new functions to aid with this? It seems like a lot of manual work to do this very often.Overlook
Not sure. I can't check, but if you follow the link to the "more general solution", but look to baptists's solution. You might find something useful in baptise's egg package.Beckybecloud
In order to install egg I had to do install.packages("digest") install.packages("devtools") library(digest) devtools::install_github("baptiste/egg") library(egg)Theophylline
R
17

The cowplot package also has the align_plots function for this purpose (output not shown),

both2 <- align_plots(p1, p2, align="hv", axis="tblr")
p1x <- ggdraw(both2[[1]])
p2x <- ggdraw(both2[[2]])
save_plot("cow1.png", p1x)
save_plot("cow2.png", p2x)

and also plot_grid which saves the plots to the same file.

library(cowplot)
both <- plot_grid(p1, p2, ncol=1, labels = c("A", "B"), align = "v")
save_plot("cow.png", both)

enter image description here

Raincoat answered 10/8, 2017 at 14:34 Comment(0)
T
10

As @hadley suggests, rbind.gtable should be able to handle this,

  grid.draw(rbind(ggplotGrob(p1), ggplotGrob(p2), size="last"))

however, the layout widths should ideally be size="max", which doesn't cope well with some types of grid units.

Tracheitis answered 29/4, 2013 at 15:13 Comment(1)
Is: Error in mmm < each : comparison of these types is not implemented what you mean? I didn't see an example of the error message on the issue page.Syphon
O
4

Just by chance, I noticed that Arun's solution he had suggested in his comments hasn't been picked up. I feel his simple and efficient approach is really worth to be illustrated.

Arun suggested to move the legend to the top or bottom:

ggplot(df, aes(x=factor(0), fill=x)) + geom_bar() + theme(legend.position = "bottom")
ggplot(df, aes(x=factor(0), fill=y)) + geom_bar() + theme(legend.position = "bottom")

enter image description here enter image description here

Now, the plots have the same width as requested. In addition, the plot area is equally sized in both cases.

If there are more factors or even longer labels, it might become necessary to play around with the legend, e.g., to display the legend in two ore more rows. theme() and guide_legend() have several parameters to control the position and appearance of legends in ggplot2.

Opsis answered 14/1, 2017 at 10:3 Comment(0)
V
2

I created a little function based on the answer of @Sandy.

same.size.ggplot <- function(vector.string.graph, # a vector of strings which correspond to Robject ggplot graphs
                             reference.string.graph, # a string of a  Robject ggplot graphs where height and/or height will be taken for reference
                             width = T, # if you wanna adapat only the width
                             height = F # if you wanna adapat only the height
) {

  # example: same.size.ggplot(p0rep(c("a", "b"), thre), "a30") 


  which(vector.string.graph %in% reference.string.graph)

  newref <- ggplotGrob(get(reference.string.graph))
  ref.width <- newref$widths
  ref.height <- newref$heights

  assign(reference.string.graph, newref, env = parent.frame(1))

  for(i in seq_along(vector.string.graph)) {
    if(vector.string.graph[i] != reference.string.graph) {
      new <- ggplotGrob(get(vector.string.graph[i]))
      if( width ) {
        new$widths <- ref.width
      }
      if( height ) {
        new$heights <- ref.height
      }
      assign(vector.string.graph[i], new, env = parent.frame(1))
    }
  }
}
p1 <- ggplot(data.frame(x=c("a","b","c"),y=c("happy","sad","ambivalent about life")),aes(x=factor(0),fill=x)) + geom_bar()
p2 <- ggplot(data.frame(x=c("a","b","c"),y=c("happy","sad","ambivalent about life")),aes(x=factor(0),fill=y)) + geom_bar()
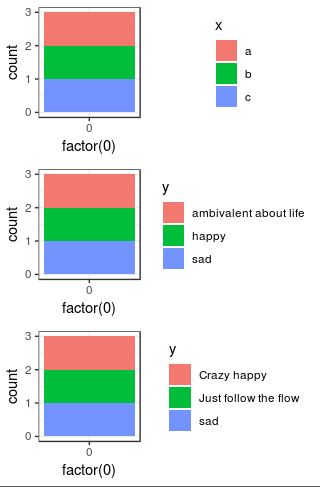
p3 <- ggplot(data.frame(x=c("a","b","c"),y=c("Crazy happy","sad","Just follow the flow")),aes(x=factor(0),fill=y)) + geom_bar()

grid.arrange(p1, p2, p3, ncol = 1)

same.size.ggplot(c("p1", "p2", "p3"), "p2") # same as same.size.ggplot(c("p2", "p3"), "p1") 

grid.arrange(p1, p2, p3, ncol = 1)

Before

enter image description here

After

enter image description here

Vaclava answered 21/8, 2019 at 15:17 Comment(0)
J
2

You could also use the patchwork-package for that:

require(ggplot2)
require(patchwork)
# data
df = data.frame(x = c("a", "b", "c"),
                y = c("happy", "sad", "ambivalent about life"))
p1 = ggplot(df, aes(x=factor(0), fill=x)) + geom_bar()
p2 = ggplot(df, aes(x=factor(0), fill=y)) + geom_bar()

# Patchwork 1: Does it automatically
p1 / p2

# Patchwork 2: Create a list
l = patchwork::align_patches(p1, p2)
Johannessen answered 10/2, 2022 at 14:8 Comment(0)
C
0

As a quick & dirty solution that also works across plots that are not combined into one, you can prepend the legend title with some spaced:

library(ggplot2)
df <- data.frame(x=c("a", "b", "c"),
                 y=c("happy", "sad", "ambivalent about life"))
fix_width_lab <- function(lab, width=40) paste0(paste0(rep(" ", width), collapse = ""), "\n", lab)
ggplot(df, aes(x=factor(0), fill=x)) + geom_bar() + labs(fill = fix_width_lab("x"))

ggplot(df, aes(x=factor(0), fill=y)) + geom_bar() + labs(fill = fix_width_lab("y"))

Created on 2023-11-24 with reprex v2.0.2

Commerce answered 24/11, 2023 at 17:21 Comment(0)

© 2022 - 2024 — McMap. All rights reserved.