Put stars on ggplot barplots and boxplots - to indicate the level of significance (p-value)
Asked Answered
S

6

62

It's common to put stars on barplots or boxplots to show the level of significance (p-value) of one or between two groups, below are several examples:

enter image description hereenter image description hereenter image description here

The number of stars are defined by p-value, for example one can put 3 stars for p-value < 0.001, two stars for p-value < 0.01, and so on (although this changes from one article to the other).

And my questions: How to generate similar charts? The methods that automatically put stars based on significance level are more than welcome.

Stomatic answered 13/6, 2013 at 10:17 Comment(3)
This is a pretty broad question. Can you narrow it down? And perhaps show what you've tried so far?Microcopy
Most journals nowadays dislike the star notation, even if some table in R still print these. Check with you journal first.Tridactyl
the bottom-left one is easy: you set up a data.frame with the positions of those stars and add a geom_text layer with labels "***".Crapshooter
E
47

Please find my attempt below.

Example plot

First, I created some dummy data and a barplot which can be modified as we wish.

windows(4,4)

dat <- data.frame(Group = c("S1", "S1", "S2", "S2"),
                  Sub   = c("A", "B", "A", "B"),
                  Value = c(3,5,7,8))  

## Define base plot
p <-
ggplot(dat, aes(Group, Value)) +
    theme_bw() + theme(panel.grid = element_blank()) +
    coord_cartesian(ylim = c(0, 15)) +
    scale_fill_manual(values = c("grey80", "grey20")) +
    geom_bar(aes(fill = Sub), stat="identity", position="dodge", width=.5)

Adding asterisks above a column is easy, as baptiste already mentioned. Just create a data.frame with the coordinates.

label.df <- data.frame(Group = c("S1", "S2"),
                       Value = c(6, 9))

p + geom_text(data = label.df, label = "***")

To add the arcs that indicate a subgroup comparison, I computed parametric coordinates of a half circle and added them connected with geom_line. Asterisks need new coordinates, too.

label.df <- data.frame(Group = c(1,1,1, 2,2,2),
                       Value = c(6.5,6.8,7.1, 9.5,9.8,10.1))

# Define arc coordinates
r <- 0.15
t <- seq(0, 180, by = 1) * pi / 180
x <- r * cos(t)
y <- r*5 * sin(t)

arc.df <- data.frame(Group = x, Value = y)

p2 <-
p + geom_text(data = label.df, label = "*") +
    geom_line(data = arc.df, aes(Group+1, Value+5.5), lty = 2) +
    geom_line(data = arc.df, aes(Group+2, Value+8.5), lty = 2)

Lastly, to indicate comparison between groups, I built a larger circle and flattened it at the top.

r <- .5
x <- r * cos(t)
y <- r*4 * sin(t)
y[20:162] <- y[20] # Flattens the arc

arc.df <- data.frame(Group = x, Value = y)

p2 + geom_line(data = arc.df, aes(Group+1.5, Value+11), lty = 2) +
     geom_text(x = 1.5, y = 12, label = "***")
Eduino answered 22/11, 2014 at 2:17 Comment(4)
It takes very long time to plot between-groups line in my case. Anyway to speed it up?Bagby
I am trying to replace label = "***" with label = "p=0.02", but the text get very bold, any suggestions?Bagby
this can be set by size like: geom_text(size=1)Dogtrot
usually when text looks very bold the issue is that there are many identical labels being printed one on top of another.Iatry
R
93

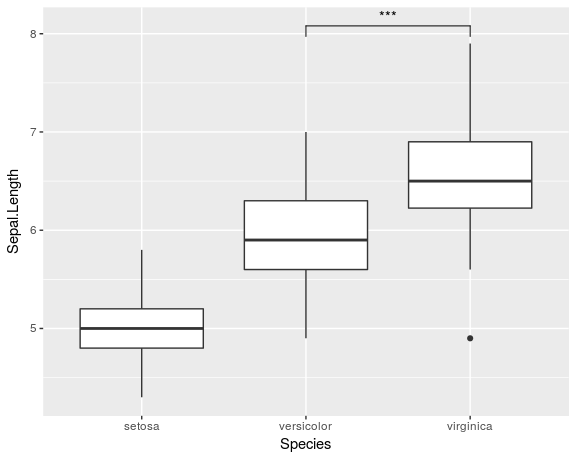
I know that this is an old question and the answer by Jens Tierling already provides one solution for the problem. But I recently created a ggplot-extension that simplifies the whole process of adding significance bars: ggsignif

Instead of tediously adding the geom_line and geom_text to your plot you just add a single layer geom_signif:

library(ggplot2)
library(ggsignif)

ggplot(iris, aes(x=Species, y=Sepal.Length)) + 
  geom_boxplot() +
  geom_signif(comparisons = list(c("versicolor", "virginica")), 
              map_signif_level=TRUE)

Boxplot with significance bar

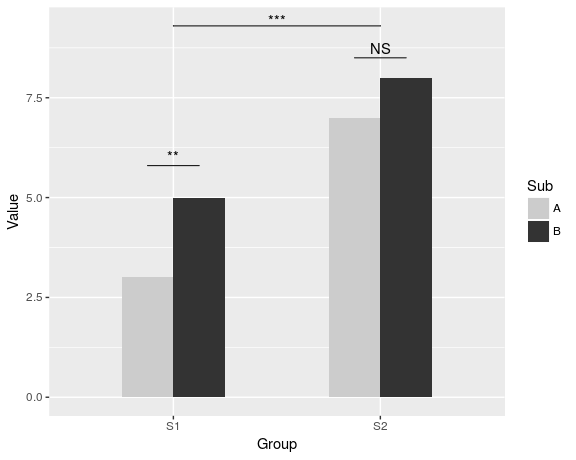
To create a more advanced plot similar to the one shown by Jens Tierling, you can do:

dat <- data.frame(Group = c("S1", "S1", "S2", "S2"),
              Sub   = c("A", "B", "A", "B"),
              Value = c(3,5,7,8))  

ggplot(dat, aes(Group, Value)) +
  geom_bar(aes(fill = Sub), stat="identity", position="dodge", width=.5) +
  geom_signif(stat="identity",
              data=data.frame(x=c(0.875, 1.875), xend=c(1.125, 2.125),
                              y=c(5.8, 8.5), annotation=c("**", "NS")),
              aes(x=x,xend=xend, y=y, yend=y, annotation=annotation)) +
  geom_signif(comparisons=list(c("S1", "S2")), annotations="***",
              y_position = 9.3, tip_length = 0, vjust=0.4) +
  scale_fill_manual(values = c("grey80", "grey20"))

enter image description here

Full documentation of the package is available at CRAN.

Reverie answered 5/4, 2017 at 12:33 Comment(7)
Hi. Can I have square brackets (to identify which group is the comparsion) for the second graphic also?Viridescent
Sure, just set tip_length to something other than 0Reverie
Tks. but it just worked for the second geom_signif, not for the first one (the one that contains the data.frame.Viridescent
Interesting, that is not how it's supposed to be... Would you mind opening an issue at github.com/const-ae/ggsignif/issues with a small reproducible example. I would take a look then ant try to figure out what is happening :)Reverie
problem is that you can only use the implemented statistical test, which probably is some simple mean comparison. Many disciplines cannot work with these simple tests when comparing two groups.Xena
@Jaynes01, this incorrect. With the test argument you can call any test that you want.Reverie
Ok, so you can fit a model that I otherwise can only build in Stan (because there is no ready made package to create it) in the geom_signif function? It would be better to also have an option to add stars for more complex tests or even for alternative decision criteria (other than p-values).Xena
E
47

Please find my attempt below.

Example plot

First, I created some dummy data and a barplot which can be modified as we wish.

windows(4,4)

dat <- data.frame(Group = c("S1", "S1", "S2", "S2"),
                  Sub   = c("A", "B", "A", "B"),
                  Value = c(3,5,7,8))  

## Define base plot
p <-
ggplot(dat, aes(Group, Value)) +
    theme_bw() + theme(panel.grid = element_blank()) +
    coord_cartesian(ylim = c(0, 15)) +
    scale_fill_manual(values = c("grey80", "grey20")) +
    geom_bar(aes(fill = Sub), stat="identity", position="dodge", width=.5)

Adding asterisks above a column is easy, as baptiste already mentioned. Just create a data.frame with the coordinates.

label.df <- data.frame(Group = c("S1", "S2"),
                       Value = c(6, 9))

p + geom_text(data = label.df, label = "***")

To add the arcs that indicate a subgroup comparison, I computed parametric coordinates of a half circle and added them connected with geom_line. Asterisks need new coordinates, too.

label.df <- data.frame(Group = c(1,1,1, 2,2,2),
                       Value = c(6.5,6.8,7.1, 9.5,9.8,10.1))

# Define arc coordinates
r <- 0.15
t <- seq(0, 180, by = 1) * pi / 180
x <- r * cos(t)
y <- r*5 * sin(t)

arc.df <- data.frame(Group = x, Value = y)

p2 <-
p + geom_text(data = label.df, label = "*") +
    geom_line(data = arc.df, aes(Group+1, Value+5.5), lty = 2) +
    geom_line(data = arc.df, aes(Group+2, Value+8.5), lty = 2)

Lastly, to indicate comparison between groups, I built a larger circle and flattened it at the top.

r <- .5
x <- r * cos(t)
y <- r*4 * sin(t)
y[20:162] <- y[20] # Flattens the arc

arc.df <- data.frame(Group = x, Value = y)

p2 + geom_line(data = arc.df, aes(Group+1.5, Value+11), lty = 2) +
     geom_text(x = 1.5, y = 12, label = "***")
Eduino answered 22/11, 2014 at 2:17 Comment(4)
It takes very long time to plot between-groups line in my case. Anyway to speed it up?Bagby
I am trying to replace label = "***" with label = "p=0.02", but the text get very bold, any suggestions?Bagby
this can be set by size like: geom_text(size=1)Dogtrot
usually when text looks very bold the issue is that there are many identical labels being printed one on top of another.Iatry
B
41

There is also an extension of the ggsignif package called ggpubr that is more powerful when it comes to multi-group comparisons. It builds on top of ggsignif, but also handles anova and kruskal-wallis as well as pairwise comparisons against the gobal mean.

Example:

library(ggpubr)

my_comparisons = list( c("0.5", "1"), c("1", "2"), c("0.5", "2") )

ggboxplot(ToothGrowth, x = "dose", y = "len",
          color = "dose", palette = "jco")+ 
  stat_compare_means(comparisons = my_comparisons, label.y = c(29, 35, 40))+
  stat_compare_means(label.y = 45)

enter image description here

Borras answered 24/7, 2017 at 9:51 Comment(4)
This might be a screenshot from this site: (very useful site, too) r-bloggers.com/add-p-values-and-significance-levels-to-ggplotsIdyllic
But how to combine with geom_boxplot fromggplot?Cockup
Please, how can you plot the significance level (***) instead of the p-values? This example does not show this. Thank you!Volans
@Volans I've updated my answer to use stars instead.Borras
O
6

I found this one is useful.

library(ggplot2)
library(ggpval)
data("PlantGrowth")
plt <- ggplot(PlantGrowth, aes(group, weight)) +
  geom_boxplot()
add_pval(plt, pairs = list(c(1, 3)), test='wilcox.test')
Oestrogen answered 31/1, 2019 at 0:8 Comment(0)
S
3

Made my own function:

ts_test <- function(dataL,x,y,method="t.test",idCol=NULL,paired=F,label = "p.signif",p.adjust.method="none",alternative = c("two.sided", "less", "greater"),...) {
    options(scipen = 999)

    annoList <- list()

    setDT(dataL)

    if(paired) {
        allSubs <- dataL[,.SD,.SDcols=idCol] %>% na.omit %>% unique
        dataL   <- dataL[,merge(.SD,allSubs,by=idCol,all=T),by=x]  #idCol!!!
    }

    if(method =="t.test") {
        dataA <- eval(parse(text=paste0(
                       "dataL[,.(",as.name(y),"=mean(get(y),na.rm=T),sd=sd(get(y),na.rm=T)),by=x] %>% setDF"
                       )))
        res<-pairwise.t.test(x=dataL[[y]], g=dataL[[x]], p.adjust.method = p.adjust.method,
                        pool.sd = !paired, paired = paired,
                        alternative = alternative, ...)
    }

    if(method =="wilcox.test") {
        dataA <- eval(parse(text=paste0(
            "dataL[,.(",as.name(y),"=median(get(y),na.rm=T),sd=IQR(get(y),na.rm=T,type=6)),by=x] %>% setDF"
        )))
        res<-pairwise.wilcox.test(x=dataL[[y]], g=dataL[[x]], p.adjust.method = p.adjust.method,
                             paired = paired, ...)
    }

    #Output the groups
    res$p.value %>% dimnames %>%  {paste(.[[2]],.[[1]],sep="_")} %>% cat("Groups ",.)

    #Make annotations ready
    annoList[["label"]] <- res$p.value %>% diag %>% round(5)

    if(!is.null(label)) {
        if(label == "p.signif"){
            annoList[["label"]] %<>% cut(.,breaks = c(-0.1, 0.0001, 0.001, 0.01, 0.05, 1),
                                         labels = c("****", "***", "**", "*", "ns")) %>% as.character
        }
    }

    annoList[["x"]] <- dataA[[x]] %>% {diff(.)/2 + .[-length(.)]}
    annoList[["y"]] <- {dataA[[y]] + dataA[["sd"]]} %>% {pmax(lag(.), .)} %>% na.omit

    #Make plot
    coli="#0099ff";sizei=1.3

    p <-ggplot(dataA, aes(x=get(x), y=get(y))) + 
        geom_errorbar(aes(ymin=len-sd, ymax=len+sd),width=.1,color=coli,size=sizei) +
        geom_line(color=coli,size=sizei) + geom_point(color=coli,size=sizei) + 
        scale_color_brewer(palette="Paired") + theme_minimal() +
        xlab(x) + ylab(y) + ggtitle("title","subtitle")


    #Annotate significances
    p <-p + annotate("text", x = annoList[["x"]], y = annoList[["y"]], label = annoList[["label"]])

    return(p)
}

Data and call:

library(ggplot2);library(data.table);library(magrittr);

df_long    <- rbind(ToothGrowth[,-2],data.frame(len=40:50,dose=3.0))
df_long$ID <- data.table::rowid(df_long$dose)

ts_test(dataL=df_long,x="dose",y="len",idCol="ID",method="wilcox.test",paired=T)

Result:

enter image description here

Shawana answered 28/2, 2018 at 11:20 Comment(0)
C
2

There is also a simple tool in the library superb call showSignificance which allows you to put whatever text you want, horizontally or vertically. For example

library(ggplot2)
library(superb)

ggplot(iris, aes(x=Species, y=Sepal.Length)) + 
  geom_boxplot() +
  showSignificance( c(1,2), 7.5, -0.05, "**") + 
  showSignificance( c(2,3), 4.5, +0.05, "n.s.") + 
  showSignificance( 3.45, c(6.5,5.9), -0.02, "yup!")

Result with Iris dataset

Crosscrosslet answered 6/8, 2023 at 18:26 Comment(0)

© 2022 - 2025 — McMap. All rights reserved.