Subset data points outside confidence interval
Asked Answered
C

1

1

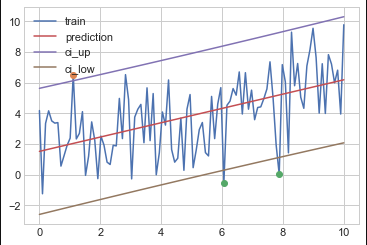
Using the same example as from this previous question (code pasted below), we can get the 95% CI with the summary_table function from statsmodels outliers_influence. But now, how would it be possible to only subset the data points (x and y) that are outside the confidence interval?

import numpy as np
import statsmodels.api as sm
from statsmodels.stats.outliers_influence import summary_table

#measurements genre
n = 100
x = np.linspace(0, 10, n)
e = np.random.normal(size=n)
y = 1 + 0.5*x + 2*e
X = sm.add_constant(x)
re = sm.OLS(y, X).fit()
st, data, ss2 = summary_table(re, alpha=0.05)
predict_ci_low, predict_ci_upp = data[:, 6:8].T
Cruzeiro answered 29/5, 2018 at 13:39 Comment(0)
C
1

It might be a bit late for this, but you could put it in a pandas.DataFrame and filter depending on a list of booleans. Assuming I got your question:

import numpy as np
import statsmodels.api as sm
from statsmodels.stats.outliers_influence import summary_table
import matplotlib.pyplot as plot

## Import pandas
import pandas as pd

#measurements genre
n = 100
x = np.linspace(0, 10, n)
e = np.random.normal(size=n)
y = 1 + 0.5*x + 2*e
X = sm.add_constant(x)
re = sm.OLS(y, X).fit()
st, data, ss2 = summary_table(re, alpha=0.05)

# Make prediction
prediction = re.predict(X)
predict_ci_low, predict_ci_upp = data[:, 6:8].T
# Put y and x in a pd.DataFrame
df = pd.DataFrame(y).set_index(x)

# Get the y values that are out of the ci intervals. This could be done directly in the df indexer
out_up = y > predict_ci_upp
out_down = y < predict_ci_low

# Plot everything
plot.plot(x, y, label = 'train')
plot.plot(df[out_up], marker = 'o', linewidth = 0)
plot.plot(df[out_down], marker = 'o', linewidth = 0)
plot.plot(x, predictionTrain, label = 'prediction')
plot.plot(x, predict_ci_upp, label = 'ci_up')
plot.plot(x, predict_ci_low, label = 'ci_low')
plot.legend(loc='best')

Here is the resulting plot:

enter image description here

Chiao answered 23/7, 2019 at 11:22 Comment(0)

© 2022 - 2024 — McMap. All rights reserved.