How to plot a wav file
Asked Answered
W

8

63

I have just read a wav file with scipy and now I want to make the plot of the file using matplotlib, on the "y scale" I want to see the amplitude and over the "x scale" I want to see the numbers of frames!
Any help how can I do this??
Thank you!

from scipy.io.wavfile import read
import numpy as np
from numpy import*
import matplotlib.pyplot as plt
a=read("C:/Users/Martinez/Desktop/impulso.wav")
print a
Wisner answered 4/9, 2013 at 22:52 Comment(3)
what does print a output?Ignominy
Is this a single or multi-channel wavfile?Huerta
The print a, just show a tuple with the raw data of the audio file. And it is a mono wavfile.Ventilation
A
91

You can call wave lib to read an audio file.

To plot the waveform, use the "plot" function from matplotlib

import matplotlib.pyplot as plt
import numpy as np
import wave
import sys


spf = wave.open("wavfile.wav", "r")

# Extract Raw Audio from Wav File
signal = spf.readframes(-1)
signal = np.fromstring(signal, np.int16)


# If Stereo
if spf.getnchannels() == 2:
    print("Just mono files")
    sys.exit(0)

plt.figure(1)
plt.title("Signal Wave...")
plt.plot(signal)
plt.show()

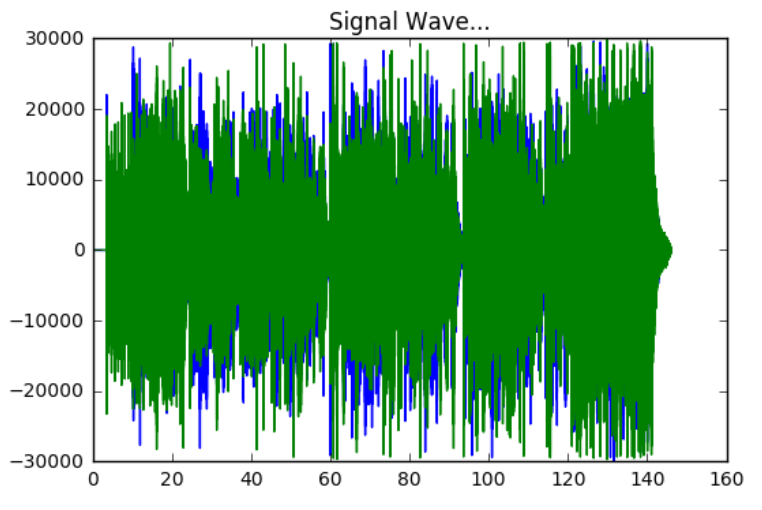
you will have something like:enter image description here

To Plot the x-axis in seconds you need get the frame rate and divide by size of your signal, you can use linspace function from numpy to create a Time Vector spaced linearly with the size of the audio file and finally you can use plot again like plt.plot(Time,signal)

import matplotlib.pyplot as plt
import numpy as np
import wave
import sys


spf = wave.open("Animal_cut.wav", "r")

# Extract Raw Audio from Wav File
signal = spf.readframes(-1)
signal = np.fromstring(signal, np.int16)
fs = spf.getframerate()

# If Stereo
if spf.getnchannels() == 2:
    print("Just mono files")
    sys.exit(0)


Time = np.linspace(0, len(signal) / fs, num=len(signal))

plt.figure(1)
plt.title("Signal Wave...")
plt.plot(Time, signal)
plt.show()

New plot x-axis in seconds:

enter image description here

Actinolite answered 4/9, 2013 at 23:15 Comment(8)
That' perfect man, but what if I want to see the time over the x-axis, in seconds?? How do I make that possible??Ventilation
Ederwander, for some reason I don't know when I plot my file it just shows the data backwards!enter image description here: I have copied the same that you have write! Any suggestion?Ventilation
does not make sense, if you really think that the data is inverted, use any function of numpy to transposed your vector ....Actinolite
out of curiosity I compared the results with the plot in python and Audacity, you can see The Same waveform hereActinolite
how do you do this where you save this output as a JPG or PNG instead of display it onscreen?Jody
@Actinolite How do I go about if I want to this to be an interactive plot? i.e if I hover on the image it should display the values at that point. Thanks.Calfskin
if the length of the wav file is less than one second, Time axis length will be zero because of integer division. It should be made a float. Time=np.linspace(0, float(len(signal))/fs, num=len(signal))Sexist
how would you do this with a video file's sound?Diahann
G
31

Alternatively, if you want to use SciPy, you may also do the following:

from scipy.io.wavfile import read
import matplotlib.pyplot as plt

# read audio samples
input_data = read("Sample.wav")
audio = input_data[1]
# plot the first 1024 samples
plt.plot(audio[0:1024])
# label the axes
plt.ylabel("Amplitude")
plt.xlabel("Time")
# set the title  
plt.title("Sample Wav")
# display the plot
plt.show()
Granulate answered 2/8, 2014 at 14:16 Comment(2)
Any suggestions for how to edit this to handle 24 bit depth wav files?Tipster
Awesome answer @CuriousCoder! If this is done for a mp3 file, would the units on the Y-axis be decibels?Catnap
A
19

Here's a version that will also handle stereo inputs, based on the answer by @ederwander

import matplotlib.pyplot as plt
import numpy as np
import wave

file = 'test.wav'

with wave.open(file,'r') as wav_file:
    #Extract Raw Audio from Wav File
    signal = wav_file.readframes(-1)
    signal = np.fromstring(signal, 'Int16')

    #Split the data into channels 
    channels = [[] for channel in range(wav_file.getnchannels())]
    for index, datum in enumerate(signal):
        channels[index%len(channels)].append(datum)

    #Get time from indices
    fs = wav_file.getframerate()
    Time=np.linspace(0, len(signal)/len(channels)/fs, num=len(signal)/len(channels))

    #Plot
    plt.figure(1)
    plt.title('Signal Wave...')
    for channel in channels:
        plt.plot(Time,channel)
    plt.show()

enter image description here

Agace answered 20/2, 2017 at 19:31 Comment(1)
Works, pretty slow though. Use the oneliner channels = [signal[channel::num_channels] for channel in range(num_channels)] to get it crazy fast.Fernald
D
18

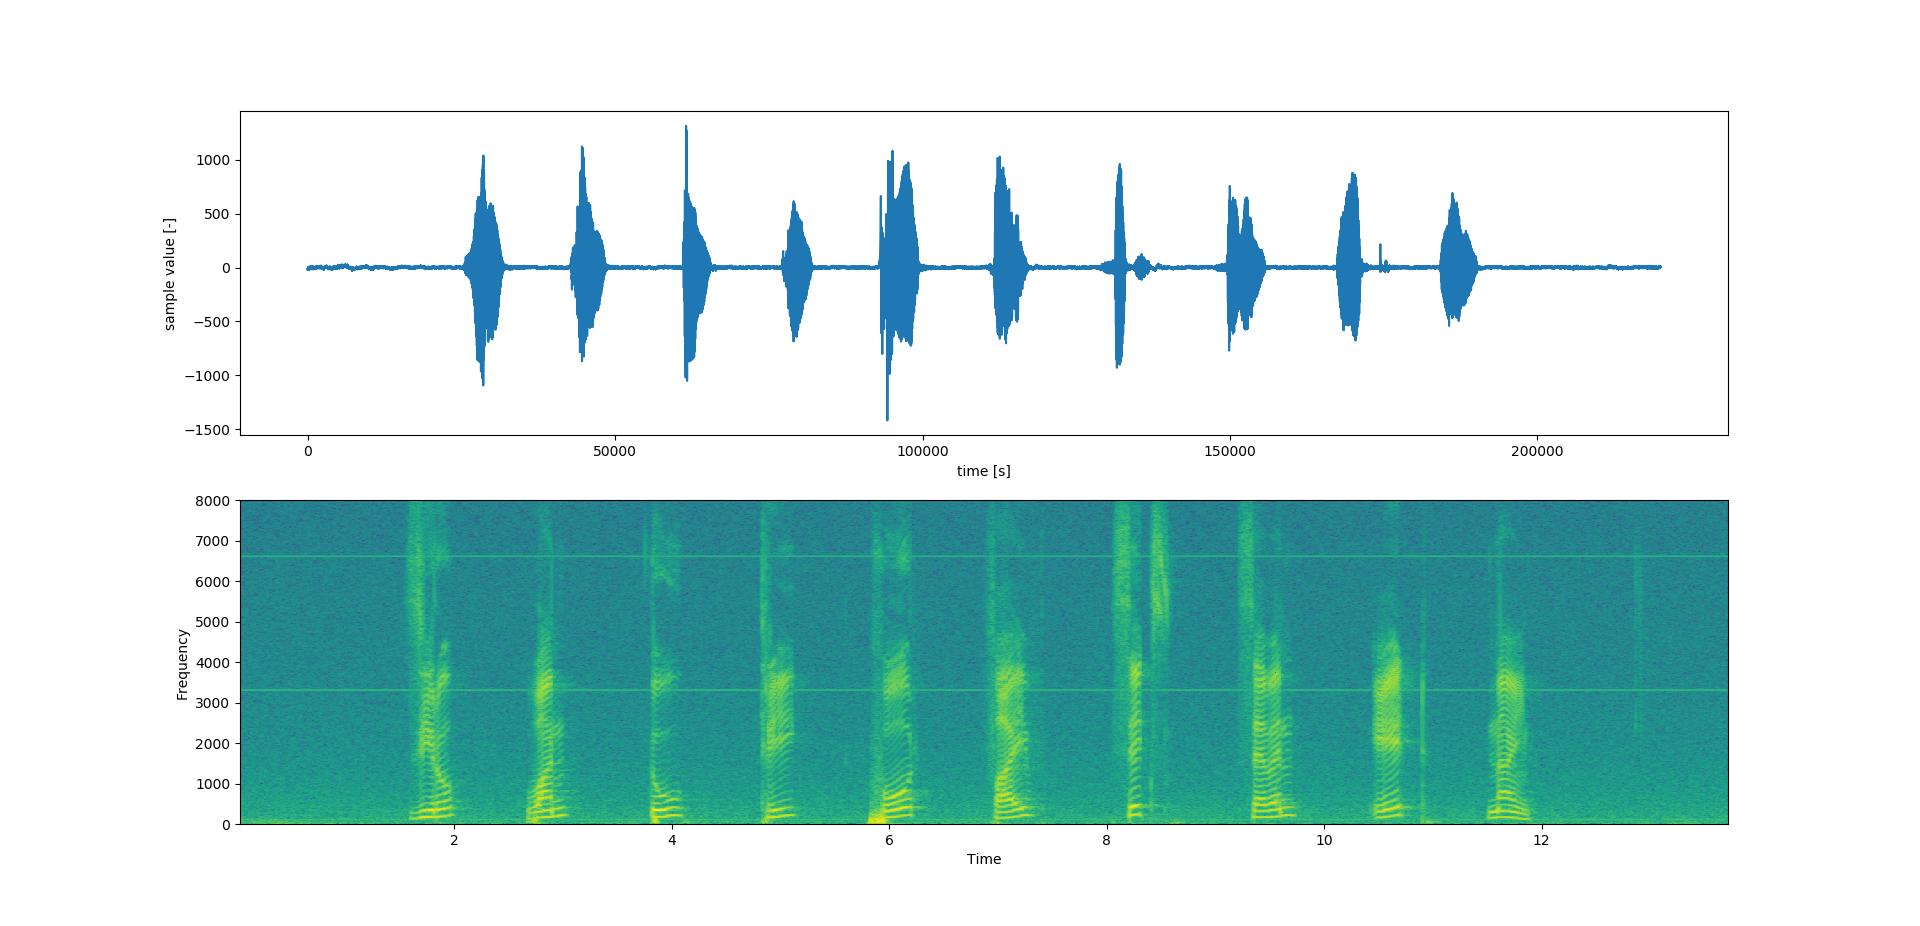
Here is the code to draw a waveform and a frequency spectrum of a wavefile

import wave
import numpy as np
import matplotlib.pyplot as plt

signal_wave = wave.open('voice.wav', 'r')
sample_rate = 16000
sig = np.frombuffer(signal_wave.readframes(sample_rate), dtype=np.int16)

For the whole segment of the wave file

sig = sig[:]

For partial segment of the wave file

sig = sig[25000:32000]

Separating stereo channels

left, right = data[0::2], data[1::2]

Plot the waveform (plot_a) and the frequency spectrum (plot_b)

plt.figure(1)

plot_a = plt.subplot(211)
plot_a.plot(sig)
plot_a.set_xlabel('sample rate * time')
plot_a.set_ylabel('energy')

plot_b = plt.subplot(212)
plot_b.specgram(sig, NFFT=1024, Fs=sample_rate, noverlap=900)
plot_b.set_xlabel('Time')
plot_b.set_ylabel('Frequency')

plt.show()

wave signal and spectrogram of the signal

Demonology answered 8/8, 2019 at 7:45 Comment(2)
what is data?Hogshead
it's a typo... replace data with sig and it works great! Thanks @nikhil parasharSawyere
E
16

Just an observation (I cannot add comment).

You will receive the following mesage:

DeprecationWarning: Numeric-style type codes are deprecated and will resultin an error in the future.

Do not use np.fromstring with binaries. Instead of signal = np.fromstring(signal, 'Int16'), it's preferred to use signal = np.frombuffer(signal, dtype='int16').

Ephesians answered 25/2, 2018 at 21:11 Comment(0)
B
5

Here is a version that handles mono/stereo and 8-bit/16-bit PCM.

import matplotlib.pyplot as plt
import numpy as np
import wave

file = 'test.wav'

wav_file = wave.open(file,'r')

#Extract Raw Audio from Wav File
signal = wav_file.readframes(-1)
if wav_file.getsampwidth() == 1:
    signal = np.array(np.frombuffer(signal, dtype='UInt8')-128, dtype='Int8')
elif wav_file.getsampwidth() == 2:
    signal = np.frombuffer(signal, dtype='Int16')
else:
    raise RuntimeError("Unsupported sample width")

# http://schlameel.com/2017/06/09/interleaving-and-de-interleaving-data-with-python/
deinterleaved = [signal[idx::wav_file.getnchannels()] for idx in range(wav_file.getnchannels())]

#Get time from indices
fs = wav_file.getframerate()
Time=np.linspace(0, len(signal)/wav_file.getnchannels()/fs, num=len(signal)/wav_file.getnchannels())

#Plot
plt.figure(1)
plt.title('Signal Wave...')
for channel in deinterleaved:
    plt.plot(Time,channel)
plt.show()
Buttress answered 18/8, 2018 at 9:18 Comment(0)
G
2

I suppose I could've put this in a comment, but building slightly on the answers from both @ederwander and @TimSC, I wanted to make something more fine (as in detailed) and aesthetically pleasing. The code below creates what I think is a very nice waveform of a stereo or mono wave file (I didn't need a title so I just commented that out, nor did I need the show method - just needed to save the image file).

Here's an example of a stereo wav rendered: enter image description here

And the code, with the differences I mentioned:

import matplotlib.pyplot as plt
import numpy as np
import wave

file = '/Path/to/my/audio/file/DeadMenTellNoTales.wav'

wav_file = wave.open(file,'r')

#Extract Raw Audio from Wav File
signal = wav_file.readframes(-1)
if wav_file.getsampwidth() == 1:
    signal = np.array(np.frombuffer(signal, dtype='UInt8')-128, dtype='Int8')
elif wav_file.getsampwidth() == 2:
    signal = np.frombuffer(signal, dtype='Int16')
else:
    raise RuntimeError("Unsupported sample width")

# http://schlameel.com/2017/06/09/interleaving-and-de-interleaving-data-with-python/
deinterleaved = [signal[idx::wav_file.getnchannels()] for idx in range(wav_file.getnchannels())]

#Get time from indices
fs = wav_file.getframerate()
Time=np.linspace(0, len(signal)/wav_file.getnchannels()/fs, num=len(signal)/wav_file.getnchannels())
plt.figure(figsize=(50,3))
#Plot
plt.figure(1)
#don't care for title
#plt.title('Signal Wave...')
for channel in deinterleaved:
    plt.plot(Time,channel, linewidth=.125)
#don't need to show, just save
#plt.show()
plt.savefig('/testing_folder/deadmentellnotales2d.png', dpi=72)
Genus answered 9/8, 2019 at 23:54 Comment(0)
F
0

I came up with a solution that's more flexible and more performant:

  • Downsampling is used to achieve two samples per second. This is achieved by calculating the average of absolute values for each window. The result looks like the waveforms from streaming sites like SoundCloud.
  • Multi-channel is supported (thanks @Alter)
  • Numpy is used for each operation, which is much more performant than looping through the array.
  • The file is processed in batches to support very large files.
import matplotlib.pyplot as plt
import numpy as np
import wave
import math

file = 'audiofile.wav'

with wave.open(file,'r') as wav_file:
    num_channels = wav_file.getnchannels()
    frame_rate = wav_file.getframerate()
    downsample = math.ceil(frame_rate * num_channels / 2) # Get two samples per second!

    process_chunk_size = 600000 - (600000 % frame_rate)

    signal = None
    waveform = np.array([])

    while signal is None or signal.size > 0:
        signal = np.frombuffer(wav_file.readframes(process_chunk_size), dtype='int16')

        # Take mean of absolute values per 0.5 seconds
        sub_waveform = np.nanmean(
            np.pad(np.absolute(signal), (0, ((downsample - (signal.size % downsample)) % downsample)), mode='constant', constant_values=np.NaN).reshape(-1, downsample),
            axis=1
        )

        waveform = np.concatenate((waveform, sub_waveform))

    #Plot
    plt.figure(1)
    plt.title('Waveform')
    plt.plot(waveform)
    plt.show()
Fernald answered 18/11, 2019 at 16:1 Comment(1)
I am getting and error on np.pad saying that "ValueError: cannot convert float NaN to integer" any idea of how it might be fixed?Propraetor

© 2022 - 2024 — McMap. All rights reserved.