How to create a ServiceMonitor for prometheus-operator?
Asked Answered
E

5

64

Recently, prometheus-operator has been promoted to stable helm chart (https://github.com/helm/charts/tree/master/stable/prometheus-operator).

I'd like to understand how to add a custom application to monitoring by prometheus-operator in a k8s cluster. An example for say gitlab runner which by default provides metrics on 9252 would be appreciated (https://docs.gitlab.com/runner/monitoring/#configuration-of-the-metrics-http-server).

I have a rudimentary yaml that obviously doesn't work but also not provides any feedback on what isn't working:

apiVersion: monitoring.coreos.com/v1
kind: ServiceMonitor
metadata:
  name: gitlab-monitor
  # Change this to the namespace the Prometheus instance is running in
  namespace: default
  labels:
    app: gitlab-runner-gitlab-runner
    release: prometheus
spec:
  selector:
    matchLabels:
      app: gitlab-runner-gitlab-runner
  namespaceSelector:
    # matchNames:
    # - default
    any: true
  endpoints:
  - port: http-metrics
    interval: 15s

This is the prometheus configuration:

> kubectl get prometheus -o yaml

...
serviceMonitorNamespaceSelector: {}
serviceMonitorSelector:
  matchLabels:
    release: prometheus
...

So the selectors should match. By "not working" I mean that the endpoints do not appear in the prometheus UI.

Etiquette answered 25/10, 2018 at 13:52 Comment(5)
Could you please post the output of kubectl get prometheus -o yaml. There you have to specify serviceMonitorNamespaceSelector: {} and serviceMonitorSelector: {} (example will select all serviceMonitors in all namespaces). Your ServiceMonitor definition looks fine to me.Vidovik
Improved yaml and added prometheus config above.Etiquette
could you please define serviceMonitorSelector: {} just to exclude that this selector does not work properly. You can also check the annotations of your services. I have a selector matchLabels: <key>: <value> in my case and it does work. I'm not sure if namespaceSelector: # matchNames: # - default any: true also works.Vidovik
Based on the monitors shipped with prometheus operator I can even drop the namespaceSelector altogether (though I've tried both approaches). Not showing up in prometheus targets. Is there any logfile I could check for where service monitors are getting picked up?Etiquette
Bang head against wall. Looking at github.com/coreos/prometheus-operator/blob/… I need a service too, not only a service monitor?Etiquette
E
44

Thanks to Peter who showed me that it idea in principle wasn't entirely incorrect I've found the missing link. As a servicemonitor does monitor services (haha), I missed the part of creating a service which isn't part of the gitlab helm chart. Finally this yaml did the trick for me and the metrics appear in Prometheus:

# Service targeting gitlab instances
apiVersion: v1
kind: Service
metadata:
  name: gitlab-metrics
  labels:
    app: gitlab-runner-gitlab-runner
spec:
  ports:
  - name: metrics # expose metrics port
    port: 9252 # defined in gitlab chart
    targetPort: metrics
    protocol: TCP
  selector:
    app: gitlab-runner-gitlab-runner # target gitlab pods
---
apiVersion: monitoring.coreos.com/v1
kind: ServiceMonitor
metadata:
  name: gitlab-metrics-servicemonitor
  # Change this to the namespace the Prometheus instance is running in
  # namespace: default
  labels:
    app: gitlab-runner-gitlab-runner
    release: prometheus
spec:
  selector:
    matchLabels:
      app: gitlab-runner-gitlab-runner # target gitlab service
  endpoints:
  - port: metrics
    interval: 15s

Nice to know: the metrics targetPort is defined in the gitlab runner chart.

Etiquette answered 26/10, 2018 at 16:36 Comment(2)
Use release: kube-prometheus-stack tag instead of release: prometheus when installed operator from kube-prometheus stack helmKeyboard
Very nice but what namespace should hold your ServiceMonitor gitlab-metrics-servicemonitor?Nickell
K
42

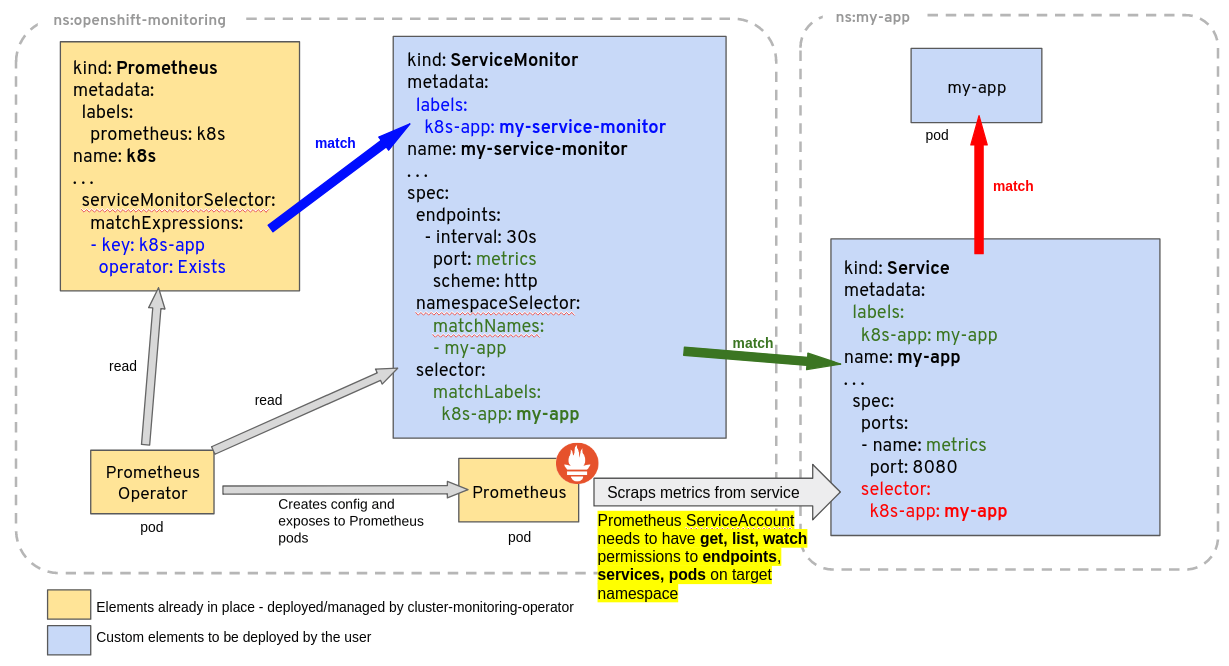
This image perfectly shows the connection between Prometheus,ServiceMonitors and Services

enter image description here

If any of the matches are not correct, targets won't show up.

Read more: https://github.com/prometheus-operator/prometheus-operator/blob/main/Documentation/troubleshooting.md#troubleshooting-servicemonitor-changes

Keyboard answered 22/12, 2021 at 19:2 Comment(2)
Actually, Prometheus doesn't scrape metrics from the Service. Prometheus asks the Service "hey what are your Endpoints?". Then Prometheus will scrape each Endpoint individually (which is the same as scrapping each pod individually). Which is why usually every pod has an exporter side-car, so metrics can be reported per pod.Venuti
I really like the image depicting the concept of ServiceMonitor, whenever a colleague asks how does it work I show them this picture.Olander
A
23

I know this question is already answered. But I had a similar problem when Prometheus deployed in Kubernetes with Helm's stable/prometheus-operator chart couldn't find any active targets for my ServiceMonitor. It turned out that my Service exposed a port that I didn't explicitly named:

  - protocol: TCP
    port: 8080
    targetPort: uwsgi

I could use it in Ingress by targeting uwsgi port. But it seems that ServiceMonitor needs an explicitly named port in Service even if it has the same name as its own tagetPort:

  - name: uwsgi
    protocol: TCP
    port: 8080
    targetPort: uwsgi

I have written a blog post about this problem here

Antifederalist answered 1/6, 2019 at 11:42 Comment(4)
What if I use a port directly, like 7896? I think it is okay tooLudly
@vrs, i've tried your fix but didn't work. can you please help? #60780948Coeternal
Thanks for the blog. Although, now I am confused as to what purpose is served by the annotations prometheus.io/scrape and prometheus.io/port on Deployments?Auberbach
Purpose is the same and should work as well, but annotations considered a deprecated way of targeting the services, AFAIKBract
S
3

The above solutions are working fine till now.

The Release Label is important. Without this, Prom cannot add the app metrics to its target list.

Make sure you add the correct Release Label by checking in the ServiceMonitor of Prometheus itself. Also make sure to add the release Label to the Service and Deployment file too, in the metadata & Specs section.

If you encounter a situation where Prometheus is showing the Target but not the endpoints, take a look at this: https://github.com/prometheus-operator/prometheus-operator/issues/3053

Solanaceous answered 22/11, 2021 at 23:26 Comment(1)
This is how you find and check the serviceMonitor selector from Prometheus: kubectl -n <your-prometheus-namespace> get prometheus and then kubectl -n <your-prometheus-namespace> get prometheus <resource-name-you-just-found-out> -oyaml . Look for the attribute serviceMonitorSelector:Keyboard
B
0

To add to the previous answers, by using the kube-prometheus-stack helm chart, there is no need to create the kind: Prometheus k8s template.

Only the ServiceMonitor will be enough, with the proper port name and the matchLabels referring to the Service labels, the ServiceMonitor itself can be without labels.

ref:

https://github.com/prometheus-operator/prometheus-operator/blob/main/Documentation/troubleshooting.md#using-textual-port-number-instead-of-port-name

Borglum answered 20/10, 2023 at 5:56 Comment(0)

© 2022 - 2024 — McMap. All rights reserved.