How to plot dates as dates (not numbers or character) on x axis of ggplot?
Asked Answered
H

1

0

I have a huge data set containing bacteria samples (4 types of bacteria) from 10 water resources from 2010 until 2019. some values are missing so we need to not include them in the plot or analysis.

I want to plot a time series for each type of bacteria for each resource for all years. What is the best way to do that?

library("ggplot2")
BactData= read.csv('Råvannsdata_Bergen_2010_2018a.csv', sep='\t',header=TRUE)
summary(BactData,na.rm = TRUE)
df$Date = as.Date( df$Date, '%d/%m/%Y')
#require(ggplot2)
ggplot( data = df, aes( Date,BactData$Svartediket_CB )) + geom_line() 
#plot(BactData$Svartediket_CB,col='brown')
plot(BactData$Svartediket_CP,col='cyan')
plot(BactData$Svartediket_EC,col='magenta')
plot(BactData$Svartediket_IE,col='darkviolet')

using plot is not satisfactory because the x axis is just numbers not dates . Tried to use ggplot but got an error message. I am beginner in R.

Error message

Error in df$Date : object of type 'closure' is not subsettable

Data as CVS file with tab delimiter

Hapsburg answered 23/11, 2019 at 13:35 Comment(1)
to get you started, your data is in BactData but you are attempting to change a date in something called df. The format for your date should look like as.Date(date, format = "%d.%m.%y")Grocery
P
0

This will do the trick

BactData = read.csv('Råvannsdata_Bergen_2010_2018a.csv', sep='\t',header=TRUE, stringsAsFactors = F)

colnames(BactData)[1] <- "Date"

library(lubridate)
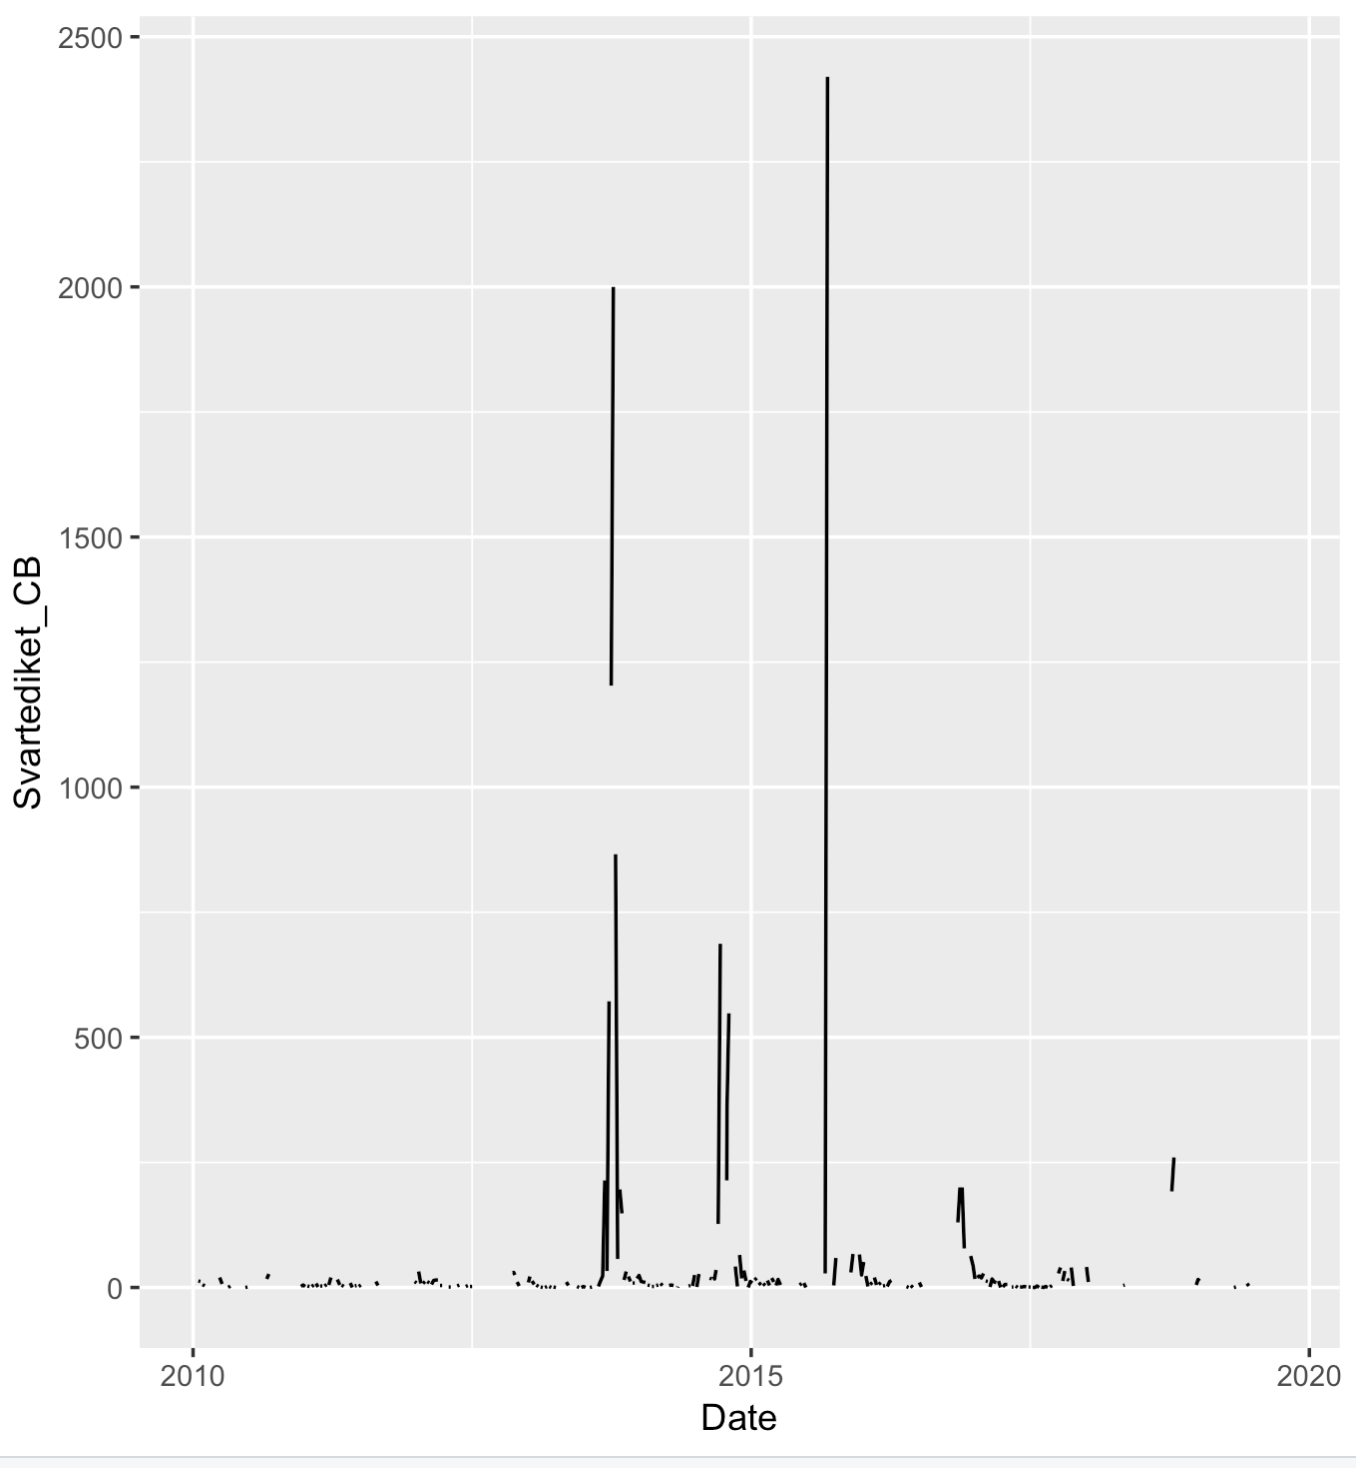
BactData$Date = dmy(BactData$Date) # converts strings to date class 
ggplot(data = BactData, aes(Date, Svartediket_CB )) + geom_line()

enter image description here

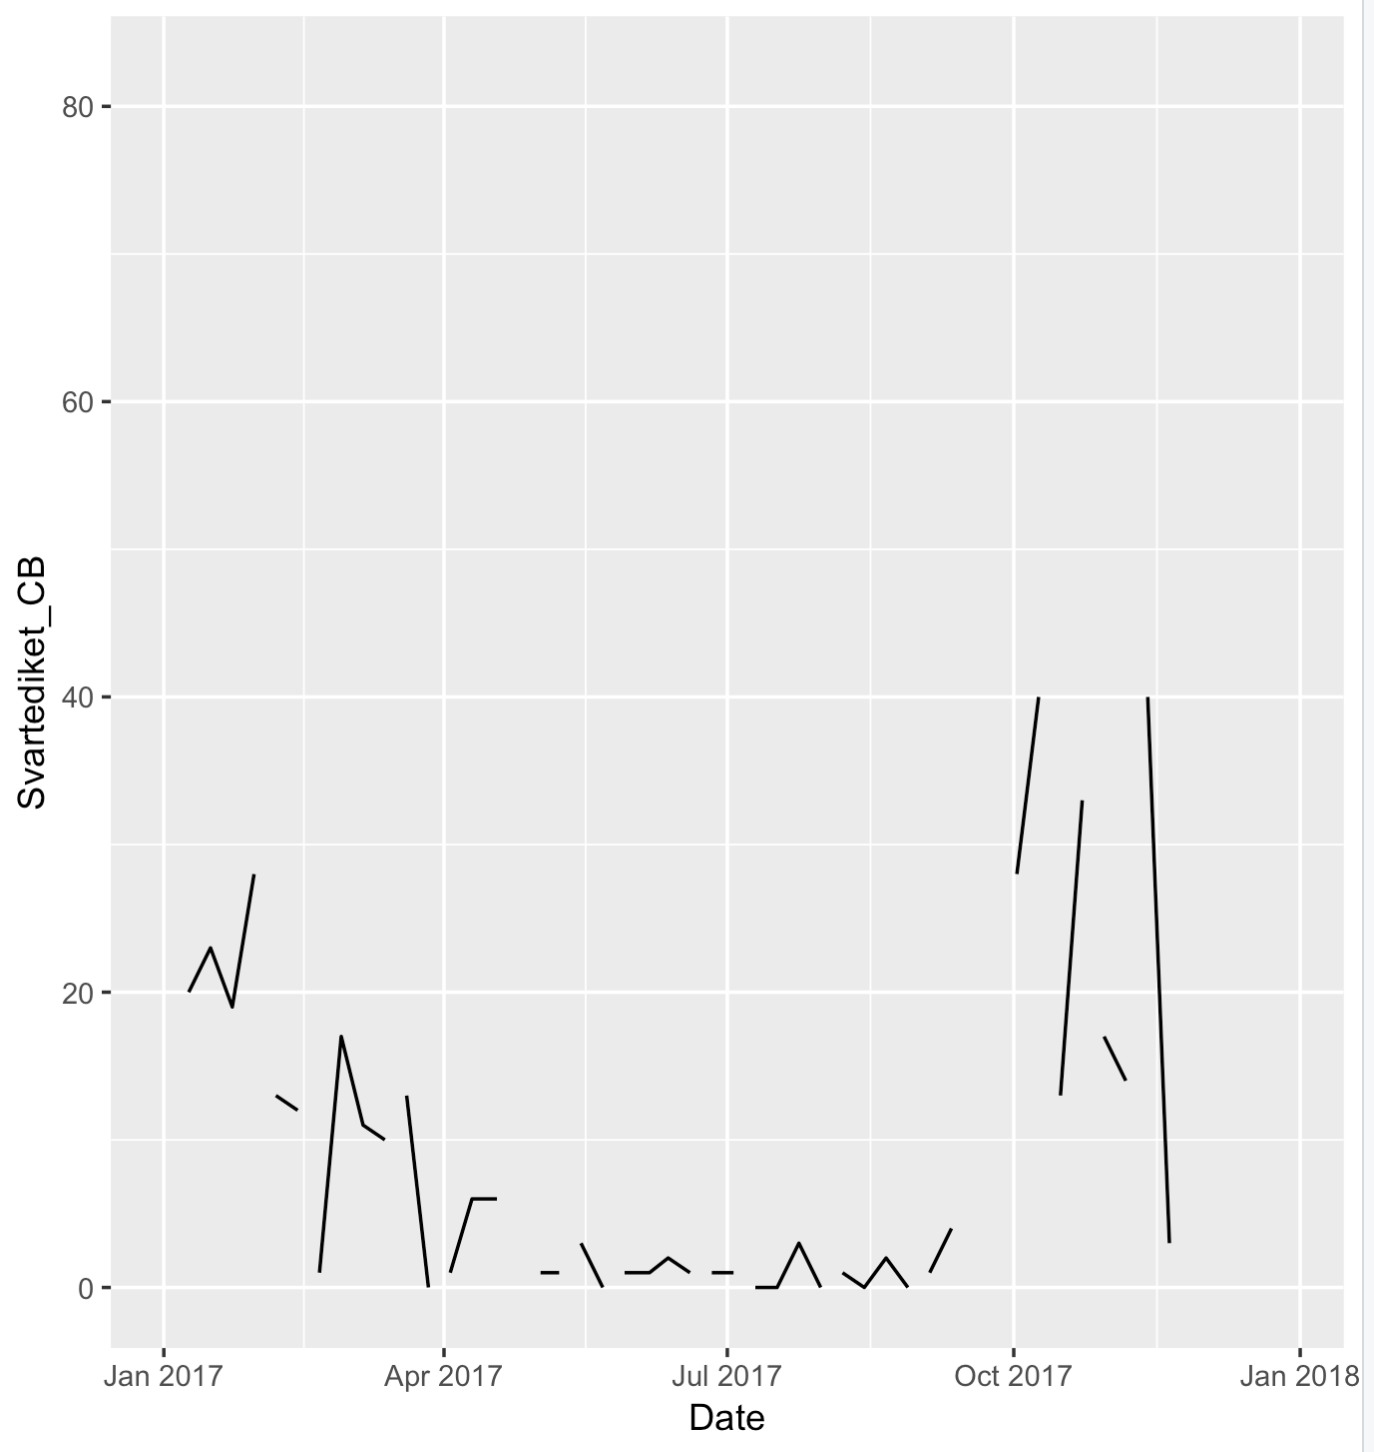
You can filter for any year using dplyr with lubridate. For example, 2017:

library(dplyr)
BactData %>% filter(year(Date) == 2017) %>% 
  ggplot(aes(Date, Svartediket_CB )) + geom_line()

enter image description here

Or for two years

library(dplyr)
BactData %>% filter(year(Date) == 2017 | year(Date) == 2018) %>% 
  ggplot(aes(Date, Svartediket_CB )) + geom_line()
Pourparler answered 23/11, 2019 at 13:48 Comment(3)
Thanks, How to make the plot for just one year or two years?Hapsburg
@F.O I have updated the answer to show how to filter the data for one (or two) years' data before plotting.Pourparler
@ user5783745 Plots for Bogetveit_CB and further are empty even though there are values for them. I get this message Removed 115 rows containing missing values (geom_path).Hapsburg

© 2022 - 2024 — McMap. All rights reserved.