Vertically center-align content of columns in a beamer presentation generated with rmarkdown
Asked Answered
S

2

1

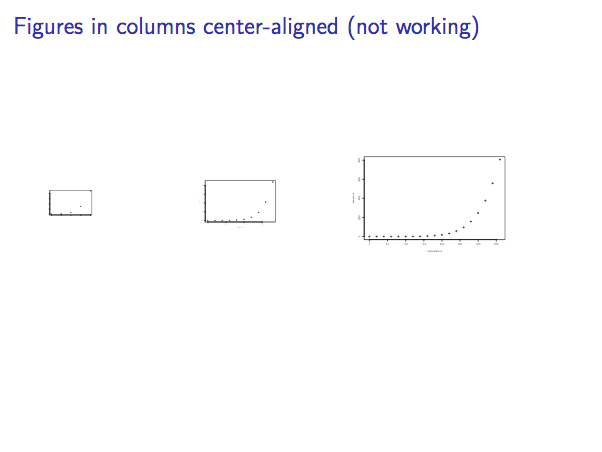
How to vertically center-align the content of multiple columns in a `rmarkdown::beamer_presentation?

As recommended in a comment in to an answer to this SO post, I tried ::: {.column width="30%"}, which however did not work for me.

enter image description here

If there is a simple way to align content differently for each column, that would further be very helpful too (e.g., c1: top, c2: middle, c3: bottom, c4: middle).

MWE

---
output:
  bookdown::pdf_book:
    base_format: rmarkdown::beamer_presentation
    slide_level: 2
    keep_tex: true
---

## Figures in columns top-aligned
::: columns

:::: {.column width="30%"}
```{r top-p-5, echo=FALSE, out.width='30%'}
plot(pressure[1:5,])
```
::::

:::: {.column width="30%"}
```{r top-p-10, echo=FALSE, out.width='50%'}
plot(pressure[1:10,])
```
::::

:::: {.column width="30%"}
```{r top-p-all, echo=FALSE, out.width='100%'}
plot(pressure[1:nrow(pressure),])
```
::::

:::

## Figures in columns center-aligned (not working)
::: columns

::: {.column width="30%"}
```{r center-p-5, echo=FALSE, out.width='30%'}
plot(pressure[1:5,])
```
:::

::: {.column width="30%"}
```{r center-p-10, echo=FALSE, out.width='50%'}
plot(pressure[1:10,])
```
:::

::: {.column width="30%"}
```{r center-p-all, echo=FALSE, out.width='100%'}
plot(pressure[1:nrow(pressure),])
```
:::

:::
Showplace answered 22/2, 2021 at 9:45 Comment(0)
P
5

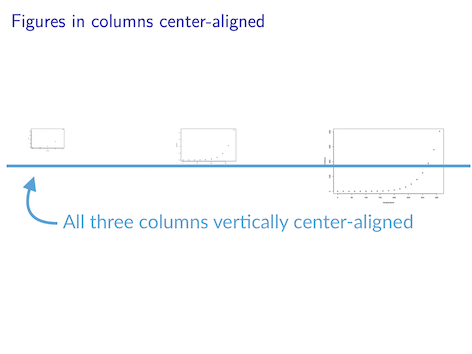
You can use :::: {.columns align=center} to get centre alignment

---
output:
  bookdown::pdf_book:
    base_format: rmarkdown::beamer_presentation
    slide_level: 2
    keep_tex: true
---

## Figures in columns top-aligned
::: columns

:::: {.column width="30%"}
```{r top-p-5, echo=FALSE, out.width='30%'}
plot(pressure[1:5,])
```
::::

:::: {.column width="30%"}
```{r top-p-10, echo=FALSE, out.width='50%'}
plot(pressure[1:10,])
```
::::

:::: {.column width="30%"}
```{r top-p-all, echo=FALSE, out.width='100%'}
plot(pressure[1:nrow(pressure),])
```
::::

:::

## Figures in columns center-aligned (not working)
:::: {.columns align=center}

::: {.column width="30%"}
```{r center-p-5, echo=FALSE, out.width='30%'}
plot(pressure[1:5,])
```
:::

::: {.column width="30%"}
```{r center-p-10, echo=FALSE, out.width='50%'}
plot(pressure[1:10,])
```
:::

::: {.column width="30%"}
```{r center-p-all, echo=FALSE, out.width='100%'}
plot(pressure[1:nrow(pressure),])
```
:::

::::

enter image description here

Prizefight answered 22/2, 2021 at 10:14 Comment(9)
Thank you for the quick reply! Your proposal unfortunately not work for me somehow. My sessionInfo R version 4.0.2 (2020-06-22), Platform: x86_64-apple-darwin17.0 (64-bit), Running under: macOS Catalina 10.15.6, knitr_1.30, rmarkdown_2.5Showplace
@Showplace It seems to work with R version 4.0.3 (2020-10-10) -- "Bunny-Wunnies Freak Out" on rstudio cloud rstudio.cloud/project/2224516Prizefight
can confirm that works on rstudio cloud. Updating "bookdown", "kableExtra", "knitr", "markdown" did not help. Will try to upgrade to R 4.0.3 later todayShowplace
upgraded to the latest version of R (4.04), updated all packages to be at least as new as the ones used by Rstudio cloud. And yet, the PDF compiled still shows all 3 plots top-aligned :( So odd that the same code leads to different results on Rstudio locally and on Rstudio cloud!Showplace
@Showplace Did you also check the version of pandoc?Prizefight
rmarkdown::pandoc_version() yielded that 2.9.2.1 is installed, so it looks pretty up-to-date.Showplace
@marvericks The latest pandoc version is 2.11.4 as of 2021/02/24. Yours may be "too old" to get centre-aligned columns. This chapter of R Markdown Cookbook guides you to use Pandoc version(s) not bundled with the RStudio IDE if you want to do so.Chauffeur
@CarlosLuisRivera Thanks a lot for the hint! Indeed, Rstudio Cloud is working with the newer pandoc 2.11.2.Showplace
For anyone else experiencing similar problems: Check the version of your local pandoc with rmarkdown::find_pandoc(). If it is "outdated", update pandoc using brew or install the latest version from GitHub. Run rmarkdown::find_pandoc(version = "X.Y.Z") (e.g., rmarkdown::find_pandoc(version = "2.11.4")) to inform rmarkdown of the change.Showplace
S
2

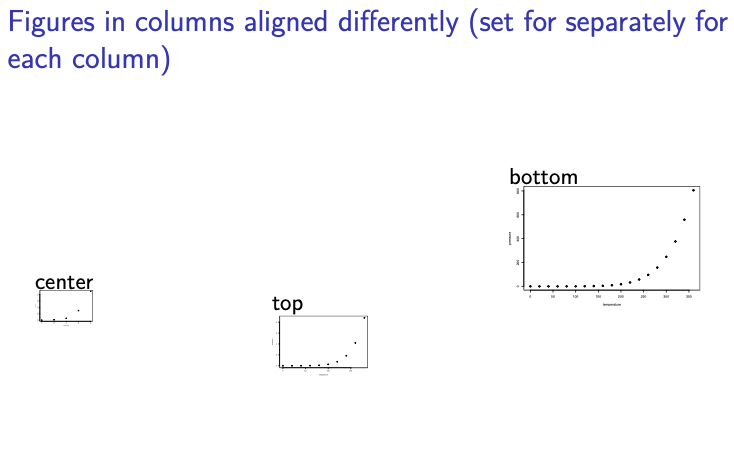
To complement the helpful answer from @samcarter_is_at_topanswers.xyz, the following approach can be employed to align content differently in each column:

---
output:
  bookdown::pdf_book:
    base_format: rmarkdown::beamer_presentation
    slide_level: 2
    keep_tex: true
---

```{r echo=FALSE}
# CHECK PANDOC VERSION
library(rmarkdown)
if (pandoc_available())
  cat("pandoc", as.character(pandoc_version()), "is available\n (pandoc >2.11.2 is required)")
```

## Figures in columns center-aligned (set for all columns at once)
:::: {.columns align=center}

::: {.column width="30%"}
```{r center-p-5, echo=FALSE, out.width='30%'}
plot(pressure[1:5,])
```
:::

::: {.column width="30%"}
```{r center-p-10, echo=FALSE, out.width='50%'}
plot(pressure[1:10,])
```
:::

::: {.column width="30%"}
```{r center-p-all, echo=FALSE, out.width='100%'}
plot(pressure[1:nrow(pressure),])
```
:::

::::


## Figures in columns aligned differently (set for separately for each column)
:::: {.columns}

::: {.column width="30%" align=center}
center
```{r 3-center-p-5, echo=FALSE, out.width='30%'}
plot(pressure[1:5,])
```
:::

::: {.column width="30%" align=top}
top
```{r 3-top-p-10, echo=FALSE, out.width='50%'}
plot(pressure[1:10,])
```
:::

::: {.column width="30%" align=bottom}
bottom
```{r 3-bottom-p-all, echo=FALSE, out.width='100%'}
plot(pressure[1:nrow(pressure),])
```
:::

::::

enter image description here

Showplace answered 24/2, 2021 at 8:36 Comment(0)

© 2022 - 2024 — McMap. All rights reserved.