Python cross correlation
Asked Answered
S

3

14

I have a pair of 1D arrays (of different lengths) like the following:

data1 = [0,0,0,1,1,1,0,1,0,0,1]
data2 = [0,1,1,0,1,0,0,1]

I would like to get the max cross correlation of the 2 series in python. In matlab, the xcorr() function will return it OK

I have tried the following 2 methods:

  1. numpy.correlate(data1, data2)
  2. signal.fftconvolve(data2, data1[::-1], mode='full')

Both methods give me the same values, but the values I get from python are different from what comes out of matlab. Python gives me integers values > 1, whereas matlab gives actual correlation values between 0 and 1.

I have tried normalizing the 2 arrays first (value-mean/SD), but the cross correlation values I get are in the thousands which doesnt seem correct.

Matlab will also give you a lag value at which the cross correlation is the greatest. I assume it is easy to do this using indices but whats the most appropriate way of doing this if my arrays contain 10's of thousands of values?

I would like to mimic the xcorr() function that matlab has, any thoughts on how I would do that in python?

Stoltzfus answered 14/9, 2014 at 6:54 Comment(5)
Please post actual and expected values from matlab and the 2 python libsSorgo
Refer this #6991971Keiko
I saw that thread a while ago and have tried all of those methods. numpy.correlate gives me values anywhere from 1-500. and matplotlib's xcorr() requires the 2 1D arrays to be of the same length (mine aren't)Stoltzfus
"If x and y are not the same length, the shorter vector is zero-padded to the length of the longer vector." From Matlab's xcorr documentation. Perhaps try that along with the matplotlib's xcorr ?Keiko
numpy's correlate is not well documented it is truly frustrating. at the very least an example or two should be added with figures.Obstinacy
P
21
numpy.correlate(arr1,arr2,"full")

gave me same output as

xcorr(arr1,arr2)

gives in matlab

Preset answered 5/10, 2014 at 2:18 Comment(3)
How do you get the time lag out of this?Stunk
adding "full" to numpy.correlate() does the trick. To get the max time lag I just call argmax() on the return from correlate()Stoltzfus
Just to clarify, lag of 0 corresponds to the center of the output array. So if c = xcorr(arr1,arr2) , then lag = argmax(c)-c.size/2Irwinirwinn
M
5

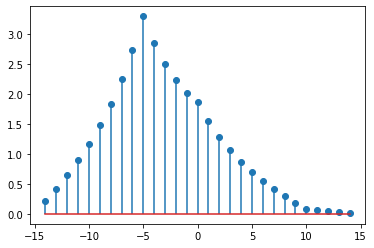
Implementation of MATLAB xcorr(x,y) and comparision of result with example.

import scipy.signal as signal
def xcorr(x,y):
    """
    Perform Cross-Correlation on x and y
    x    : 1st signal
    y    : 2nd signal

    returns
    lags : lags of correlation
    corr : coefficients of correlation
    """
    corr = signal.correlate(x, y, mode="full")
    lags = signal.correlation_lags(len(x), len(y), mode="full")
    return lags, corr

n = np.array([i for i in range(0,15)])
x = 0.84**n
y = np.roll(x,5);
lags,c = xcorr(x,y);
plt.figure()
plt.stem(lags,c)
plt.show()

output resembling matlab xcorr output

Mediocrity answered 16/5, 2021 at 9:12 Comment(0)
B
1

This code will help in finding the delay between two channels in audio file

xin, fs = sf.read('recording1.wav')
frame_len = int(fs*5*1e-3)
dim_x =xin.shape
M = dim_x[0] # No. of rows
N= dim_x[1] # No. of col
sample_lim = frame_len*100
tau = [0]
M_lim = 20000 # for testing as processing takes time
for i in range(1,N):
    c = np.correlate(xin[0:M_lim,0],xin[0:M_lim,i],"full")
    maxlags = M_lim-1
    c = c[M_lim -1 -maxlags: M_lim + maxlags]
    Rmax_pos = np.argmax(c)
    pos = Rmax_pos-M_lim+1
    tau.append(pos)
print(tau)
Bedevil answered 15/3, 2019 at 12:20 Comment(3)
While this link may answer the question, it is better to include the essential parts of the answer here and provide the link for reference. Link-only answers can become invalid if the linked page changes. - From ReviewStealthy
@Stealthy Actually there is an answer here that doesn't require the link.Chloras
@Chloras You're right. It's actually a valuable hint.Stealthy

© 2022 - 2024 — McMap. All rights reserved.