JavaScript Chart.js - Custom data formatting to display on tooltip
Asked Answered
K

12

66

I have looked at various documentation and similar questions on here, but cannot seem to find the particular solution. Apologies if I have missed anything obvious or have repeated this question!

As a bit of background info, I have implemented 4 graphs using the Chart.js plugin and passed in the required data using PHP from a database. This is all working correctly and is fine.

My problem is I need to display the data in the tooltips as formatted data aka. as numeric with %. As an example, one of my data from database is -0.17222. I have formatted it as a percentage to display in my table and all is well. However, when setting the data for the chart.js bar graph, the data is obviously missing this formatting and displaying as the -0.17222 which I do not want.

Sorry, I wanted to post a picture, but my reputation is too rubbish!

I grab data from database, then set into my table:

var kpiRex = new Handsontable(example1, {
    data: getRexData(),

Then I feed this data like so in the chart section:

data: kpiRex.getDataAtRow(3)

Any help would be great! I've been stuck on this for hours and it's probably something really simple I am overlooking.

Kroll answered 17/2, 2015 at 18:42 Comment(0)
I
40

You want to specify a custom tooltip template in your chart options, like this :

 // String - Template string for single tooltips
 tooltipTemplate: "<%if (label){%><%=label %>: <%}%><%= value + ' %' %>",
 // String - Template string for multiple tooltips
 multiTooltipTemplate: "<%= value + ' %' %>",

This way you can add a '%' sign after your values if that's what you want.

Here's a jsfiddle to illustrate this.

Note that tooltipTemplate applies if you only have one dataset, multiTooltipTemplate applies if you have several datasets.

This options are mentioned in the global chart configuration section of the documentation. Do have a look, it's worth checking for all the other options that can be customized in there.

Note that Your datasets should only contain numeric values. (No % signs or other stuff there).

Impala answered 18/2, 2015 at 9:8 Comment(0)
W
133

For chart.js 2.0+, this has changed (no more tooltipTemplate/multiTooltipTemplate). For those that just want to access the current, unformatted value and start tweaking it, the default tooltip is the same as:

options: {
    tooltips: {
        callbacks: {
            label: function(tooltipItem, data) {
                return tooltipItem.yLabel;
            }
        }
    }
}

I.e., you can return modifications to tooltipItem.yLabel, which holds the y-axis value. In my case, I wanted to add a dollar sign, rounding, and thousands commas for a financial chart, so I used:

options: {
    tooltips: {
        callbacks: {
            label: function(tooltipItem, data) {
                return "$" + Number(tooltipItem.yLabel).toFixed(0).replace(/./g, function(c, i, a) {
                    return i > 0 && c !== "." && (a.length - i) % 3 === 0 ? "," + c : c;
                });
            }
        }
    }
}
Weathersby answered 28/9, 2016 at 18:29 Comment(6)
this is nice, but it removes the series' labelsTelstar
i used callbacks to genearte my tooltip like this.. callbacks: { label: function(tooltipItem, data) { return tooltipItem.yLabel + '%'; } but it also shows x-axis value.. i want to hide x-axis value from my tooltipChristophe
@Weathersby .Yes it still display the x-axis value as well..How to display only the yAxis value.?Stator
@Telstar you can swap out the return for return data.datasets[tooltipItem.datasetIndex].label + " $" to retain the labelAustin
Documentation link: chartjs.org/docs/latest/configuration/…Pietje
For newer chartjs versions, have to use the syntax given in RC Whim's answerAlexander
A
41

In chart.js 2.1.6, I did something like this (in typescript):

  let that = this;
  options = {
    legend: {
      display: false,
      responsive: false
    },
    tooltips: {
      callbacks: {
        label: function(tooltipItem, data) {
          let account: Account = that.accounts[tooltipItem.index];
          return account.accountNumber+":"+account.balance+"€";
        }
      }
    }
  }
Ashly answered 5/7, 2016 at 13:55 Comment(0)
I
40

You want to specify a custom tooltip template in your chart options, like this :

 // String - Template string for single tooltips
 tooltipTemplate: "<%if (label){%><%=label %>: <%}%><%= value + ' %' %>",
 // String - Template string for multiple tooltips
 multiTooltipTemplate: "<%= value + ' %' %>",

This way you can add a '%' sign after your values if that's what you want.

Here's a jsfiddle to illustrate this.

Note that tooltipTemplate applies if you only have one dataset, multiTooltipTemplate applies if you have several datasets.

This options are mentioned in the global chart configuration section of the documentation. Do have a look, it's worth checking for all the other options that can be customized in there.

Note that Your datasets should only contain numeric values. (No % signs or other stuff there).

Impala answered 18/2, 2015 at 9:8 Comment(0)
E
13

The answers here did not work for me on Char.js 3.8.0. The tooltip options callbacks object has moved, apparently. Now it is under options.plugins.tooltip

https://www.chartjs.org/docs/latest/configuration/tooltip.html

Example for OP:

    options: {
        plugins: {
            tooltip: {
                callbacks: {
                    label: function (tooltipItem, data) {
                        console.log(data);
                        console.log(tooltipItem);
                        return tooltipItem.formattedValue + '%';
                    }
                }
            }
        },
        ...
Entoderm answered 23/10, 2022 at 18:42 Comment(0)
H
11

You can give tooltipTemplate a function, and format the tooltip as you wish:

tooltipTemplate: function(v) {return someFunction(v.value);}
multiTooltipTemplate: function(v) {return someOtherFunction(v.value);}

Those given 'v' arguments contain lots of information besides the 'value' property. You can put a 'debugger' inside that function and inspect those yourself.

Hummingbird answered 20/1, 2016 at 7:5 Comment(2)
what should the "someOtherFunction()" return? A string template like "<% datasetLabel - value %>", string or something else? Or more accurately what should it do? Return something or modify properties of the supplied parameter?Jitterbug
@Jitterbug someOtherFunction() should return the string you want to display in the tool tip. not a template, just the string. you can manipulate v.value as you wish, as long as you return a string. It doesn't supposed to modify v, that seems dangerous.Hummingbird
F
10
tooltips: {
          callbacks: {
            label: (tooltipItem, data) => {
              // data for manipulation
              return data.datasets[tooltipItem.datasetIndex].data[tooltipItem.index];
            },
          },
        },
Fatigued answered 3/7, 2018 at 14:19 Comment(1)
This answer covers more use cases. The selected option is right only if yLabel has an usable value, but it can be just an empty string sometimes.Dunseath
T
8

This works perfectly fine with me. It takes label and format the value.

options: {
        tooltips: {
            callbacks: {
                label: function(tooltipItem, data) {

                    let label = data.labels[tooltipItem.index];
                    let value = data.datasets[tooltipItem.datasetIndex].data[tooltipItem.index];
                    return ' ' + label + ': ' + value + ' %';

                }
            }
        }
    }
Triclinium answered 11/12, 2019 at 6:56 Comment(0)
L
7
tooltips: {
    callbacks: {
        label: function (tooltipItem) {
            return (new Intl.NumberFormat('en-US', {
                style: 'currency',
                currency: 'USD',
            })).format(tooltipItem.value);
        }
    }
}
Listen answered 4/4, 2020 at 16:37 Comment(2)
While this code may solve the question, including an explanation of how and why this solves the problem would really help to improve the quality of your post, and probably result in more up-votes. Remember that you are answering the question for readers in the future, not just the person asking now. Please edit your answer to add explanations and give an indication of what limitations and assumptions apply. From ReviewGoofball
Excellent answer, very clean!Thylacine
D
4

In Chart.Js 2.8.0, the configuration for custom tooltips can be found here: https://www.chartjs.org/docs/latest/configuration/tooltip.html#label-callback (Thanks to @prokaktus)

If you want to e.g. show some values with a prefix or postfix (In the example, the script adds a unit of kWh to the values in the chart), you could do this like:

options: {
  rotation: 1 * Math.PI,
  circumference: 1 * Math.PI,
  tooltips: {
    callbacks: {
      label: function(tooltipItem, data) {
        console.log(data);
        console.log(tooltipItem);

        var label = data.datasets[tooltipItem.datasetIndex].data[tooltipItem.index] || '';

        if (label) {
          label += ' kWh';
        }

        return label;
      }
    }
  }
}

An example fiddle is here, too: https://jsfiddle.net/y3petw58/1/

Digiovanni answered 2/4, 2019 at 9:4 Comment(0)
W
2

You need to make use of Label Callback. A common example to round data values, the following example rounds the data to two decimal places.

var chart = new Chart(ctx, {
    type: 'line',
    data: data,
    options: {
        tooltips: {
            callbacks: {
                label: function(tooltipItem, data) {
                    var label = data.datasets[tooltipItem.datasetIndex].label || '';

                    if (label) {
                        label += ': ';
                    }
                    label += Math.round(tooltipItem.yLabel * 100) / 100;
                    return label;
                }
            }
        }
    }
});

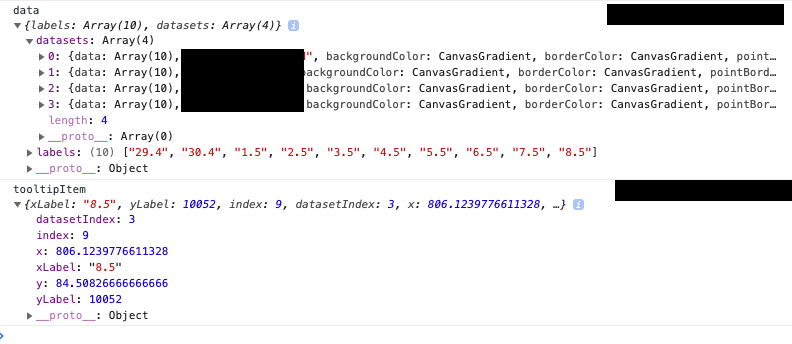
Now let me write the scenario where I used the label callback functionality.

Let's start with logging the arguments of Label Callback function, you will see structure similar to this here datasets, array comprises of different lines you want to plot in the chart. In my case it's 4, that's why length of datasets array is 4.

enter image description here

In my case, I had to perform some calculations on each dataset and have to identify the correct line, every-time I hover upon a line in a chart.

To differentiate different lines and manipulate the data of hovered tooltip based on the data of other lines I had to write this logic.

  callbacks: {
    label: function (tooltipItem, data) {
      console.log('data', data);
      console.log('tooltipItem', tooltipItem);
      let updatedToolTip: number;
      if (tooltipItem.datasetIndex == 0) {
        updatedToolTip = tooltipItem.yLabel;
      }
      if (tooltipItem.datasetIndex == 1) {
        updatedToolTip = tooltipItem.yLabel - data.datasets[0].data[tooltipItem.index];
      }
      if (tooltipItem.datasetIndex == 2) {
        updatedToolTip = tooltipItem.yLabel - data.datasets[1].data[tooltipItem.index];
      }
      if (tooltipItem.datasetIndex == 3) {
        updatedToolTip = tooltipItem.yLabel - data.datasets[2].data[tooltipItem.index]
      }
      return updatedToolTip;
    }
  } 

Above mentioned scenario will come handy, when you have to plot different lines in line-chart and manipulate tooltip of the hovered point of a line, based on the data of other point belonging to different line in the chart at the same index.

Wirer answered 8/5, 2019 at 8:48 Comment(0)
T
2

This is what my final options section looks like for chart.js version 2.8.0.

        options: {
        legend: {
            display: false //Have this or else legend will display as undefined
        },
        scales: {
            //This will show money for y-axis labels with format of $xx.xx
            yAxes: [{
              ticks: {
                beginAtZero: true,
                callback: function(value) {
                    return (new Intl.NumberFormat('en-US', {
                        style: 'currency',
                        currency: 'USD',
                    })).format(value);
                }
              }
            }]
        },
        //This will show money in tooltip with format of $xx.xx
        tooltips: {
            callbacks: {
                label: function (tooltipItem) {
                    return (new Intl.NumberFormat('en-US', {
                        style: 'currency',
                        currency: 'USD',
                    })).format(tooltipItem.value);
                }
            }
        }
    }

I wanted to show money values for both the y-axis and the tooltip values that show up when you hover over them. This works to show $49.99 and values with zero cents (ex: $50.00)

Thylacine answered 10/5, 2020 at 20:51 Comment(0)
S
1
tooltips: {
            enabled: true,
                  mode: 'single',
                  callbacks: {
                    label: function(tooltipItems, data) { 
                      return data.datasets[tooltipItems.datasetIndex].label+": "+tooltipItems.yLabel;
                    }
                  }
                }
Sinistrality answered 13/11, 2017 at 17:7 Comment(1)
you should add proper code snippet and first of all you should point out the error or problem in the script of the OP rather than just adding code and posting the answer, you should be more descriptiveObfuscate

© 2022 - 2024 — McMap. All rights reserved.