Consider a dataframe with three columns: group_ID, item_ID and value. Say we have 10 itemIDs total.
I need to rank each item_ID (1 to 10) within each group_ID based on value , and then see the mean rank (and other stats) across groups (e.g. the IDs with the highest value across groups would get ranks closer to 1). How can I do this in Pandas?
This answer does something very close with qcut, but not exactly the same.
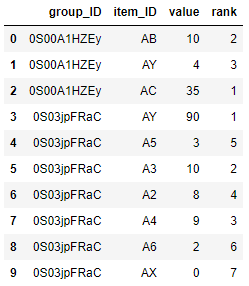
A data example would look like:
      group_ID   item_ID  value
0   0S00A1HZEy        AB     10
1   0S00A1HZEy        AY      4
2   0S00A1HZEy        AC     35
3   0S03jpFRaC        AY     90
4   0S03jpFRaC        A5      3
5   0S03jpFRaC        A3     10
6   0S03jpFRaC        A2      8
7   0S03jpFRaC        A4      9
8   0S03jpFRaC        A6      2
9   0S03jpFRaC        AX      0
which would result in:
      group_ID   item_ID   rank
0   0S00A1HZEy        AB      2
1   0S00A1HZEy        AY      3
2   0S00A1HZEy        AC      1
3   0S03jpFRaC        AY      1
4   0S03jpFRaC        A5      5
5   0S03jpFRaC        A3      2
6   0S03jpFRaC        A2      4
7   0S03jpFRaC        A4      3
8   0S03jpFRaC        A6      6
9   0S03jpFRaC        AX      7


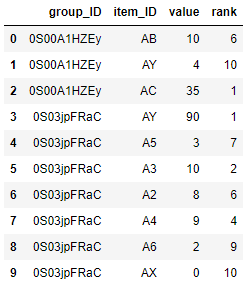
densebecause if the values are the same, they get assigned the same rank! – Injun