Recently switch to android studio from eclipse. How to check app heap and memory allocation in android studio? In Eclipse we have MAT is there anything in the studio to check heap dump, hprof file?
I'll explain it in an easy way with steps:
First, you have install MAT ( download ) or use:
brew cask install memoryanalyzer
In Android Studio open Android Device Monitor or DDMS.
Select your process "com.example.etc.."
Click Update Heap above the process list.
In the right-side panel, select the Heap tab.
Click in Cause GC.
Click Dump HPROF file above the process list.
When we downloaded the file HPROF, we have to open the Terminal and run this command to generate the file to open it with MAT.
Open terminal and run this command
./hprof-conv path/file.hprof exitPath/heap-converted.hprof
The command "hprof-conv" is in the platform-tools folder of the sdk.
- And ready and MAT can open and open the converted file ( heap-converted.hprof ) .
brew cask install memoryanalyzer for standalone MAT –
Absentee There is another way to see allocations:


I agree with above answer except below steps
Click Update Heap above the process list.
In the right-side panel, select the Heap tab.
Click in Cause GC.
They are not necessary.Just select your app/process in DDMS, and click to dump HPROF profile option. After that, follow the steps exactly as above.
One can also do the following to get more options,
- Go to Tools
- Then to Android
- finally to Android Device Monitor
First install MAT,in order to use it in Android Studio, you shall choose
Stand-alone Eclipse RCP Applicationsto install,which can be used as independent toolIn Android Studio , run your application
In the bottom-side panel, select
6:Android,then selectMemory MonitorClick
Dump Java HeapSwitch to the Captures tab (in the left-side panel), you can find the
.hproffile inHeap SnapshotfolderIn order to open the
.hproffile in MAT, you shall convert the format: left-click on the.hproffile, then chooseExport to standard .hprofOpen MAT, then open the
.hproffile that you have converted the format
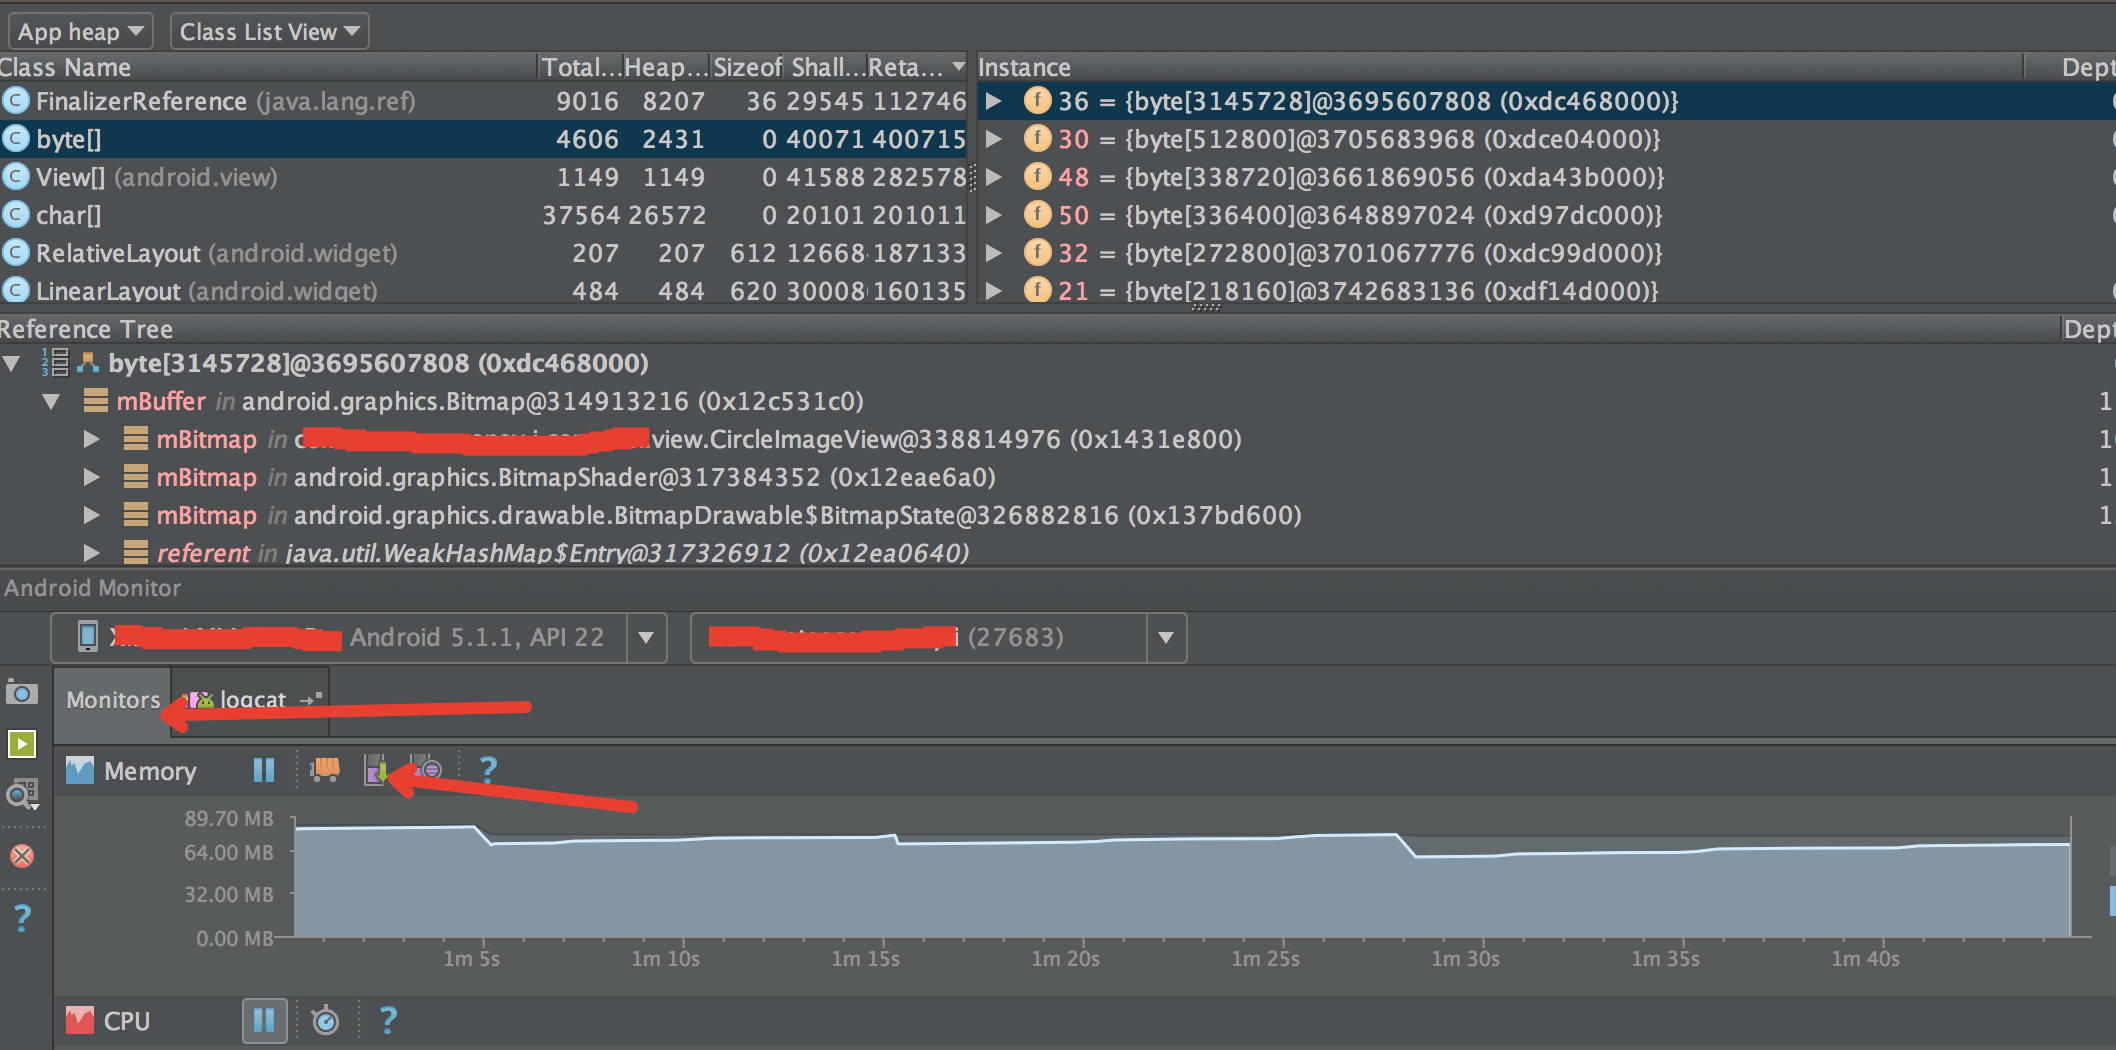
Note that in the latest Android Studio (1.3+), the heap (Android hprof) capture has been moved to the Memory Monitor subtab under the Android tab (like the first image in cVoronin's answer).
When the capture is finished, it will be automatically saved to the "captures" directory under your project (you can rename the file after the fact if you wish). The hprof file will automatically be opened up in the new hprof viewer in 1.3+.
Of course, you always have the option to convert it to standard hprof format and view it in MAT. Just right click the file in the Captures browser (under the Project browser) and select convert there. And as usual, you'd lose some additional Android-specific information along the way by not using the new viewer, since standard hprof doesn't support those.
I switched from Eclipse to Android Studio, but I still use MAT in Eclipse, with the DDMS plugin. It's so much easier.
I know this is quite an old question, but Android Studio 3 has now a built in profiler.
See documentation here: Android Profiler in Android Studio 3.0
© 2022 - 2024 — McMap. All rights reserved.

