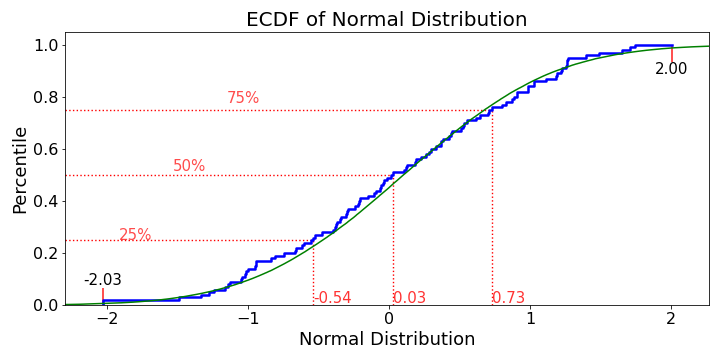
Although, there are many great answers here, though I would include a more customized ECDF plot
Generate values for the empirical cumulative distribution function
import matplotlib.pyplot as plt

def ecdf_values(x):
    """
    Generate values for empirical cumulative distribution function

    Params
    --------
        x (array or list of numeric values): distribution for ECDF

    Returns
    --------
        x (array): x values
        y (array): percentile values
    """

    # Sort values and find length
    x = np.sort(x)
    n = len(x)
    # Create percentiles
    y = np.arange(1, n + 1, 1) / n
    return x, y
def ecdf_plot(x, name = 'Value', plot_normal = True, log_scale=False, save=False, save_name='Default'):
    """
    ECDF plot of x

    Params
    --------
        x (array or list of numerics): distribution for ECDF
        name (str): name of the distribution, used for labeling
        plot_normal (bool): plot the normal distribution (from mean and std of data)
        log_scale (bool): transform the scale to logarithmic
        save (bool) : save/export plot
        save_name (str) : filename to save the plot

    Returns
    --------
        none, displays plot

    """
    xs, ys = ecdf_values(x)
    fig = plt.figure(figsize = (10, 6))
    ax = plt.subplot(1, 1, 1)
    plt.step(xs, ys, linewidth = 2.5, c= 'b');

    plot_range = ax.get_xlim()[1] - ax.get_xlim()[0]
    fig_sizex = fig.get_size_inches()[0]
    data_inch = plot_range / fig_sizex
    right = 0.6 * data_inch + max(xs)
    gap = right - max(xs)
    left = min(xs) - gap

    if log_scale:
        ax.set_xscale('log')

    if plot_normal:
        gxs, gys = ecdf_values(np.random.normal(loc = xs.mean(),
                                                scale = xs.std(),
                                                size = 100000))
        plt.plot(gxs, gys, 'g');

    plt.vlines(x=min(xs),
               ymin=0,
               ymax=min(ys),
               color = 'b',
               linewidth = 2.5)

    # Add ticks
    plt.xticks(size = 16)
    plt.yticks(size = 16)
    # Add Labels
    plt.xlabel(f'{name}', size = 18)
    plt.ylabel('Percentile', size = 18)

    plt.vlines(x=min(xs),
               ymin = min(ys),
               ymax=0.065,
               color = 'r',
               linestyle = '-',
               alpha = 0.8,
               linewidth = 1.7)

    plt.vlines(x=max(xs),
               ymin=0.935,
               ymax=max(ys),
               color = 'r',
               linestyle = '-',
               alpha = 0.8,
               linewidth = 1.7)

    # Add Annotations
    plt.annotate(s = f'{min(xs):.2f}',
                 xy = (min(xs),
                       0.065),
                horizontalalignment = 'center',
                verticalalignment = 'bottom',
                size = 15)
    plt.annotate(s = f'{max(xs):.2f}',
                 xy = (max(xs),
                       0.935),
                horizontalalignment = 'center',
                verticalalignment = 'top',
                size = 15)

    ps = [0.25, 0.5, 0.75]

    for p in ps:

        ax.set_xlim(left = left, right = right)
        ax.set_ylim(bottom = 0)

        value = xs[np.where(ys > p)[0][0] - 1]
        pvalue = ys[np.where(ys > p)[0][0] - 1]

        plt.hlines(y=p, xmin=left, xmax = value,
                    linestyles = ':', colors = 'r', linewidth = 1.4);

        plt.vlines(x=value, ymin=0, ymax = pvalue,
                   linestyles = ':', colors = 'r', linewidth = 1.4)

        plt.text(x = p / 3, y = p - 0.01,
                 transform = ax.transAxes,
                 s = f'{int(100*p)}%', size = 15,
                 color = 'r', alpha = 0.7)

        plt.text(x = value, y = 0.01, size = 15,
                 horizontalalignment = 'left',
                 s = f'{value:.2f}', color = 'r', alpha = 0.8);

    # fit the labels into the figure
    plt.title(f'ECDF of {name}', size = 20)
    plt.tight_layout()


    if save:
        plt.savefig(save_name + '.png')
ecdf_plot(np.random.randn(100), name='Normal Distribution', save=True, save_name="ecdf")
![enter image description here]()
Additional Resources:


