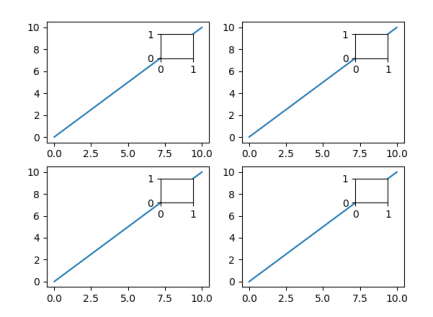
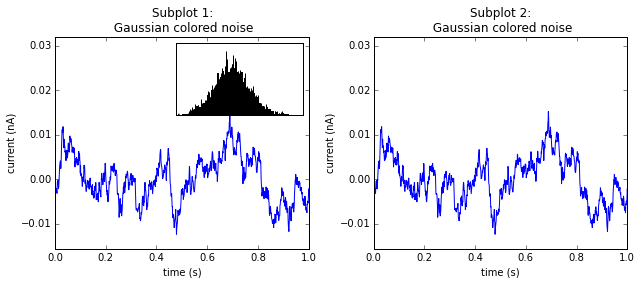
The outset library can streamline orchestration of inset plots in matplotlib.
Example
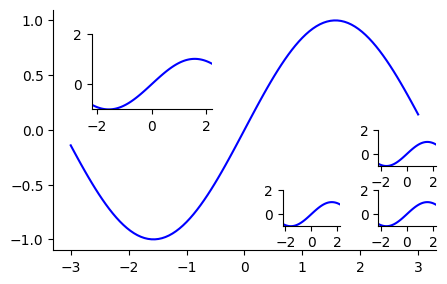
Plot a simple curve, inserting one inset in the upper left and three in the lower right.
![example outset plot]()
from matplotlib import pyplot as plt
import numpy as np
import outset as otst
from outset import util as otst_util


grid = otst.OutsetGrid(  # wrapper around seaborn FacetGrid
    # setup axlim's for inset axes
    # here, same limit for all four insets
    data=[[(-2.2, -1), (2.2, 2)]] * 4,
    aspect=1.5,  # make plots hamburger-shaped
)
otst.inset_outsets(  # arrange layout inset axes
    grid,
    # one inset in upper left, three in lower right
    insets=otst_util.layout_corner_insets(
        1, "NW", inset_grid_size=0.35,
    ) + otst_util.layout_corner_insets(
        3, "SE",
        inset_pad_ratio=0.4,
        inset_margin_size=(0.0, 0.1),
    ),
    # allow different aspect ratios across plots
    equalize_aspect=False,
    strip_ticks=False,
)
grid.broadcast(  # add plot content
    plt.plot,
    np.linspace(-3, 3, 100),
    np.sin(np.linspace(-3, 3, 100)),
    c="blue",
)

plt.show()
To install the library, python3 -m pip install outset.
Additional Features
Inset axes can also plotted on independently --- instead of using broadcast to plot content, access the main axes as grid.source_axes and the nth accessory axes as grid.outset_axes[n].
In addition to explicit specification as above, the library also provides a seaborn-like data-oriented API to infer zoom inserts containing categorical subsets of a dataframe.
Refer to the outset quickstart guide and gallery for more info.
Disclosure: am library author


