How to extract data from matplotlib plot
Asked Answered
A

7

30

I have a wxPython program which reads from different datasets, performs various types of simple on-the-fly analysis on the data and plots various combinations of the datasets to matplotlib canvas. I would like to have the opportunity to dump currently plotted data to file for more sophisticated analysis later on.

The question is: are there any methods in matplotlib that allow access to the data currently plotted in matplotlib.Figure?

Any answered 20/1, 2012 at 8:15 Comment(0)
G
40

Jakub is right about modifying the Python script to write out the data directly from the source from which it was sent into the plot; that's the way I'd prefer to do this. But for reference, if you do need to get data out of a plot, I think this should do it

gca().get_lines()[n].get_xydata()

Alternatively you can get the x and y data sets separately:

line = gca().get_lines()[n]
xd = line.get_xdata()
yd = line.get_ydata()
Glover answered 20/1, 2012 at 9:12 Comment(3)
Thanks, I think that should do it. If you want to know the reasons why I prefer dumping data from plot to messing with data sources, please see my comment to @Jacub.Any
Why doesn't a mpl_toolkits.mplot3d.art3d.Line3D object have get_zdata()? I can't extract the z values. :-(Stead
@SibbsGambling That you'd have to take up with the developers of matplotlib.Glover
T
9

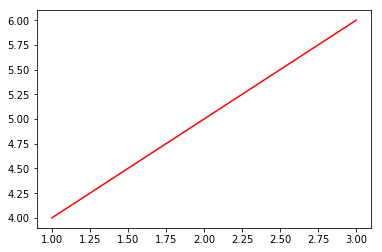
The matplotlib.pyplot.gca can be used to extract data from matplotlib plots. Here is a simple example:

import matplotlib.pyplot as plt
plt.plot([1,2,3],[4,5,6])
ax = plt.gca()
line = ax.lines[0]
line.get_xydata()

On running this, you will see 2 outputs - the plot and the data:

array([[1., 4.],
   [2., 5.],
   [3., 6.]])

enter image description here

You can also get the x data and y data seperately. On running line.get_xdata(), you will get:

array([1, 2, 3])

And on running line.get_ydata(), you will get:

array([4, 5, 6])

Note: gca stands for get current axis

Teillo answered 20/11, 2018 at 17:1 Comment(0)
K
5

To sum up, for future reference:

If plotting with plt.plot() or plt.stem() or plt.step() you can get a list of Line2D objects with:

ax = plt.gca() # to get the axis
ax.get_lines()

For plt.pie(), plt.bar() or plt.barh() you can get a list of wedge or rectangle objects with:

ax = plt.gca() # to get the axis
ax.patches()

Then, depending on the situation you can get the data by running get_xdata(), get_ydata() (see Line2D) for more info.

or i.e get_height() for a bar plot (see Rectangle) for more info.

In general for all basic plotting functions, you can find what you are looking for by running ax.get_children()

that returns a list of the children Artists (the base class the includes all of the figure's elements).

Kyoko answered 8/5, 2021 at 21:38 Comment(0)
R
1

Its Python, so you can modify the source script directly so the data is dumped before it is plotted

Relational answered 20/1, 2012 at 8:55 Comment(3)
I know that's the most pythonic way :) But first, the data is sent to plot from many places and is modified while on the plot; I would need to keep track of every modification of the plotted data. And second - I don't need to dump the data every time it is plotted. I would like first to find something interesting and then press a button on NavigationToolbar to export it to file. NavigationToolbar is linked to FigureCanvas, so the buttons have seamless access to Figure properties and methods. That's why I asked how to dump the data from plot.Any
This would only work if the user knows beforehand that they want to export the data and the data is static. Rare I would say.Dyspeptic
while this answer is a general good advice, it is not a good answer to the questionForeground
E
1

I know this is an old question, but I feel there is a solution better than the ones offered here so I decided to write this answer.

You can use unittest.mock.patch to temporarily replace the matplotlib.axes.Axes.plot function:

from unittest.mock import patch

def save_data(self, *args, **kwargs):
    # save the data that was passed into the plot function
    print(args)

with patch('matplotlib.axes.Axes.plot', new=save_data):
    # some code that will eventually plot data
    a_function_that_plots()

Once you exit the with block, Axes.plot will resume normal behavior.

Expressive answered 4/1, 2019 at 4:21 Comment(2)
Brilliant, just brilliant! Should be the accepted answer in 2021Discretionary
How do I get the data into memory without writing to file? The with kills it. global? :\Discretionary
V
0

As pointed out in the answer by @mobiuscreek, the way to extract data from axis depends on the function used for plotting: e.g., ax.get_lines() would work for a plot created via ax.plot(), but it gives an empty array, if the lines were created, e.g., using matplotlib.collections.LineCollection. (It is likely to be more of a problem when the figures are created by a third-party code.)

The general approach is then using ax.get_children() and parsing it as needed. See, e.g., this answer.

Vivica answered 22/3, 2023 at 11:34 Comment(0)
M
0

The reason it is suggested to just get the data "from the source from which it was sent into the plot" is because all matplotlib approaches need frombuffer canvas tostring_rgb()/buffer_rgba() hoopla and additionally can cause UB after that because matplotlib behaves differently on different platforms(matplotlib backends)

It's also turns out to be very slow

I just wrote my own in-numpy plotter that plots everything in vectorized way, doesn't have a single critical path loop and is at least 100x faster then the matplotlib hoopla.

https://github.com/bedbad/justpyplot

import numpy as np 
import cv2
import time
import justpyplot as jplt

xs, ys = [], []
while(cv2.waitKey(1) != 27):
    xt = time.perf_counter() - t0
    yx = np.sin(xt)
    xs.append(xt)
    ys.append(yx)
    
    frame = np.full((500,470,3), (255,255,255), dtype=np.uint8)
    
    vals = np.array(ys)

    plotted_in_array = jplt.just_plot(frame, vals,title="sin() from Clock")
    
    cv2.imshow('np array plot', plotted_in_array)
Merciful answered 21/1 at 7:20 Comment(0)

© 2022 - 2024 — McMap. All rights reserved.