Why is a Safari page breaking iOS rendering?
Asked Answered
A

1

78

I know the title is not that explanatory but here is the story: I am developing a browser game, mostly using JavaScript and the Mapbox library.

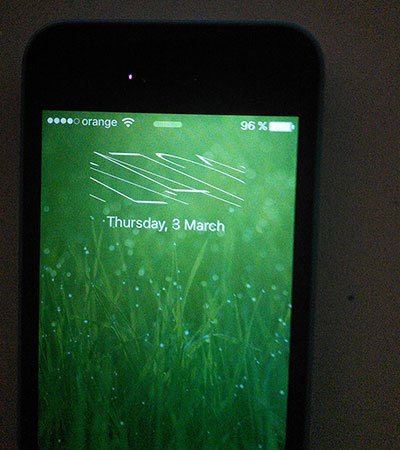
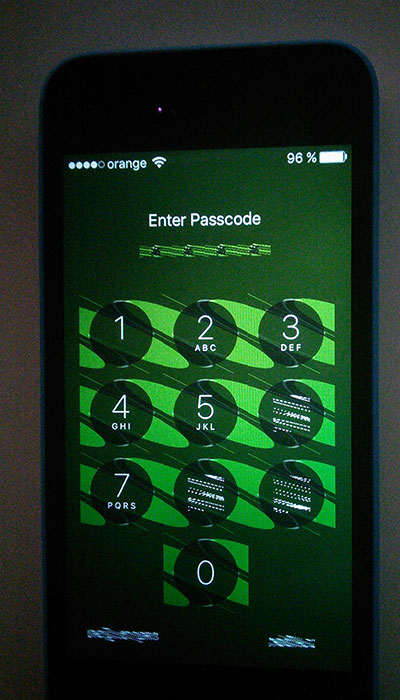
Everything works well on desktop, Android and iOS but one problem appears on iOS: after letting the game run for a few minutes the phone suddenly begins to have graphic artifacts and display most of the text scrambled.

Here are some photos of what the phone begins too look like: enter image description here enter image description here enter image description here

My question is: what exactly in my code can cause this? A memory leak? (LE: it turned out to actually be a memory leak)
The real question is: How comes that you can almost brick the entire phone by simply browsing a web page? Shouldn't Safari stop this, or at least the iOS ?

This is not a problem with this specific device, as this problem can be reproduced on different iPhone devices. (I'm not so sure about different iOS versions).

How I can reproduce the error:

  1. Open the game (inside Safari).
  2. Let it run for 3-4 minutes.
  3. Slide down the notification center and everything goes crazy.
    I have added a YouTube video showing how I can reproduce the error (on my iPhone 5C).
    It seems that the issue first appears in the notification center (if you swipe down the menu from the top).
    As for now, this problem seems to only occur on iPhone 5C iOS 9.2.1 (13D15). It also occurs on the new iOS 9.3 version.

In order to fix this issue I have to:

  1. Close the Safari application (in which the game tab is open).
  2. Lock the phone. After unlocking it everything is back to normal.

Some details about the game itself:

  1. The game shows a Mapbox map and some units over it (markers).
  2. A Node.js server runs at 1 tick/second and after each tick the updated game state is sent to the browser through Socket.io.
  3. Every time the browser receives the game state it updates the markers accordingly.
  4. *The game might also update markers if you zoom in or out or if you select them.

EDIT2: Found the memory leak (as expected). After fixing this leak (check for undefined _icon) the issue no longer occurs. This means, that somewhere along those lines the Safari/iOS bug is triggered.

Here is what exactly was being called each tick, for each unit that was clustered (was hidden and grouped with others inside a MarkerCluster):

    var $icon = $(marker._icon); // marker._icon is undefined because of the clustering

    $icon.html('');

    $icon.append($('<img class="markerIcon" src="' + options.iconUrl + '" />'));

    var iconX = 10;
    var iconY = -10;
    var iconOffset = 0;

    for(var v in this.icons) {
        this.icons[v].css('z-index', + $icon.css('z-index') + 1);
        this.icons[v].css('transform', 'translate3d(' + iconX + 'px,' 
                                + (iconY + iconOffset) + 'px,' + '0px)');
        iconOffset += 20;

        this.icons[v].appendTo($icon);
    }

    // Fire rate icons
    this.attackRateCircle = $('<div class="circle"></div>');
    this.attackRateCircle.circleProgress({
        value: 0,
        size: 16,
        fill: { color: "#b5deff" },
        emptyFill: 'rgba(0, 0, 0, 0.5)',
        startAngle:  -Math.PI / 2,
        thickness: 4,
        animation: false,
    });
    this.attackRateCircle.hide();

    // Create and display the healthbar
    this.healthBar = $('<div>').addClass('healthBar ');
    this.healthBar.css('z-index', $icon.css('z-index'));
    this.healthBarFill = $('<span class="fill">');
    this.healthBar.append(this.healthBarFill);

    $icon.append(this.healthBar);
    $icon.append(this.attackRateCircle);

And this is the icons array:

this.icons = {
    attack_order: $('<img src="img/attack.png" class="status_icon">'),
    attack: $('<img src="img/damage.png" class="status_icon icon_damage">'),
    hit: $('<img src="img/hit.png" class="status_icon icon_hit">'),
};

circleProgress call is from this library: https://github.com/kottenator/jquery-circle-progress

DEMO

Yay, I have been able to create a jsFiddle that reproduces the bug: https://jsfiddle.net/cte55cz7/14/ Open on Safari on iPhone 5C and wait a couple of minutes. On iPhone 6 and iPad mini the page crashes (as expected due to the memory leak)

Here's the same code in a HasteBin, for anyone who doesn't want to run it.

Antifriction answered 3/3, 2016 at 20:21 Comment(28)
PS: Posted on SO after being downvoted for posting the question on SuperUser. I hope that this is considered the right place to ask this question.Antifriction
Have you replicated this on any other iOS devices (another phone, and iPad, etc) to verify this isn't just an isolated incident with this device?Enunciate
@Enunciate I tested on my iPhone 5C, and another person tested (on another continent :D ) on another iPhone, but I think his model is also 5C (and he was the one who actually told me about those artifacts). I will test on an iPhone 6 and iPad mini tomorrow.Antifriction
I've never seen this, even when testing native applications that have memory leaks and cause memory usage to be completely used up on a device. I think there must be something the game is doing to stress the graphics processor in the iPhone.Enunciate
@Enunciate Yes, it is possible for it to be computing intensive (re-draw the screen many times, and probably because the tiles from Mapbox also change, many textures might be uploaded to the GPU). Still, it doesn't explain why it remains like this even after the phone is locked while the safari app is still open, it's not like Safari still runs while the phone is locked. I have no knowledge of iOS itself, but for me it seems that Safari somehow reaches and alters a memory address and corrupts data that is required for correct rendering (such as texture sizes or transformations).Antifriction
Also, while it may be a problem with my game (memory leak or worse) it still looks like an iOS (or even hardware) bug, because this issue should never occur, regardless the application being run.Antifriction
Does not reproduce on my iPhone 6. It could be a bug in CG. Can you post all the ios version info along with hardware info?Transudation
I am away atm, will post a youtube video, specs about the phone and info about what the game is basically doing in 2-3 hours. Right now I can only confirm this happening on 2 iPhone 5C devices.Antifriction
Kind of out of my realm. I am running on an emulator, logged in with b,b, and using Safari Web Inspector to examine. I do see that there is a 404 error for the resource "rulegame.com.au/client/lib/hammer.min.map".Testaceous
Wow! And I thought the screen tearing on Windows 10 Mobile was bad...Renferd
Have you tried git bisect yet?Aground
@cristy: basically, git will use binary search to help you pinpoint the error, follow this guide: robots.thoughtbot.com/git-bisect; ok try this for hg bisect: hgbook.red-bean.com/read/finding-and-fixing-mistakes.htmlAground
@Aground It's probably a bug with Safari or iOS, not with my code. Even though I would do that, I have a lot of commits and it takes a long time to reproduce the error (~5minutes). Plus, working alone, most commits are not atomic, but a lot of features at being added/removed at each commit.Antifriction
While your problem is interesting, there is nothing here to reproduce it with. External links to your repo are not good enough, the code necessary to reproduce the problem has to be in the question.Aleen
@Aleen That is the question, I would gladly post some code, but I have absolutely no idea what exactly causes this issue. I will try to remove features/code until the bug disappears, but without knowing at least vaguely where to look it will take forever to remove a function call and wait 5 minutes to reproduce the bug, given the fact that the code base is not that little. It would be helpful to know if I should look for a memory leak or a websocket connection problem or bad memory access, etc... I know nothing about iOS and how can Safari alter external system memory.Antifriction
A) I'm not even mad. That's amazing. B) I kinda wonder if this could actually be used as an exploit, since you're clearly accessing memory you shouldn't be able to, and C) I think it's interesting that everything is always tilting to the left. That suggests to me that for some reason you're increasing either the pitches (a.k.a. strides) of some textures or modifying the GPU's pitch logic. Definitely a Safari/iOS/firmware bug though.Prevenient
Debugging questions: Does increasing the node tick rate cause the error to surface earlier? Does it still occur if you disable updates entirely? Does the issue still occur if you update everything except the map on tick?Prevenient
I am debugging, I can confirm that I actually have a memory leak, I am trying to figure out the source. (not that big memory leak though, from 13MB JS Heap to 24MB JS Heap in like 5 minutes).Antifriction
From what I discovered until now: I think the memory leak is caused by the fact that when the map is zoomed out and the markers are clustered, the individual unit markers are removed. But, at each update, if an unit doesn't have its auxiliary icons added (attack icon, reloading icon) they are automatically added. To check if they were added before I check if they exist inside the marker, if not they are added. But because the marker is hidden (removed) they do not exist so they are always added. I fixed this by also checking for the marker to exist before trying to add new icons to it.Antifriction
@Aleen Added some code, that is most probably causing this issue.Antifriction
Added a JSFiddle link that re-creates the bug!Antifriction
I have submitted feedback through the Apple feedback form but I don't think they will answer too soon (I don't have an Apple developer account).Antifriction
+1 for an extremely detailed question and that much effort to share all the details! SO should make an example out of it!Dualistic
I wonder if this still occurs if the JS is run in an webview inside an app other than Safari or if this has something to do with Safari having more access to the system memory than other apps.Antifriction
Unfortunately, I haven't been able to recreate the issue on any of my devices (iPhone 6 Plus, iPad mini -1st Gen, iPad Air - 1st Gen, iPhone 4). The only thing I can think is that it is something safari is allowing the JS code to do that the graphics processor in the 5c (I believe it is the PowerVR SGX chip). Have we had any confirmations of this occuring on any other device?Enunciate
@Enunciate No, only confirmed cases are on two different iPhone 5CAntifriction
The bug still occurs on the new iOS 9.3 version.Antifriction
This question reminded of this video: youtube.com/watch?v=l7rce6IQDWsGingham
B
1

This memory leaks is probably due to how 'WebKit’s JS Engine' works [safari webkit-javascript llvm]

and really looks like to be a virtual memory buffer-overflow, having a direct impact on the remaining RAM (shared and used also by iOS to store User Interface graphical elements)

Relatively to the piece of code: "[...]finding jQuery memory leaks is easy. Check the size of $.cache. If it’s too large, inspect it and see which entries stay and why. [...]" (http://javascript.info/tutorial/memory-leaks)

Let me expect that it is relative to this for loop :

for(var v in this.icons) {
    this.icons[v].css('z-index', + $icon.css('z-index') + 1);
    this.icons[v].css('transform', 'translate3d(' + iconX + 'px,' 
                            + (iconY + iconOffset) + 'px,' + '0px)');
    iconOffset += 20;

    this.icons[v].appendTo($icon);
}

Assuming inspection is done, and also assuming the fact that you find the entries, you may want to clean the data manually with removeData() or you may use first $elem.detach() and then put $(elem).remove() in setTimeout.

Bonni answered 12/3, 2016 at 18:34 Comment(0)

© 2022 - 2024 — McMap. All rights reserved.