Is there a Profiler equivalent for MySql? [closed]
Asked Answered
D

9

79

"Microsoft SQL Server Profiler is a graphical user interface to SQL Trace for monitoring an instance of the Database Engine or Analysis Services."

I find using SQL Server Profiler extremely useful during development, testing and when I am debugging database application problems. Does anybody know if there is an equivalent program for MySql?

Doenitz answered 21/8, 2008 at 15:34 Comment(0)
B
39

Something cool that is in version 5.0.37 of the community server is MySQL's new profiler.

This may give you what info you are looking for.

Bathyscaphe answered 21/8, 2008 at 16:24 Comment(3)
FYI, the above link appears to be dead, it led me to a blank Orace search page. Here is a link to the SHOW PROFILES syntax which will help you do what you want to do: dev.mysql.com/doc/refman/5.0/en/show-profiles.html.Craigcraighead
FYI: Updated original link with snapshot from the waybackmachineStyptic
Note that this answer is about the SQL Profiler, which is primarily a profiling tool to understand how individual SQL queries are executed. This is great, but most Microsoft SQL Profiler users will be looking for a tracing tool, i.e. something that shows the SQL that's been executed.Avictor
S
13

Are you wanting to monitor performance, or just see which queries are executing? If the latter, you can configure MySQL to log all queries it's given. On a RedHat Linux box, you might add

log = /var/lib/mysql/query.log

to the [mysqld] section of /etc/my.cnf before restarting MySQL.

Remember that in a busy database scenario, those logs can grow quite large.

Skidmore answered 17/9, 2008 at 12:47 Comment(0)
L
9

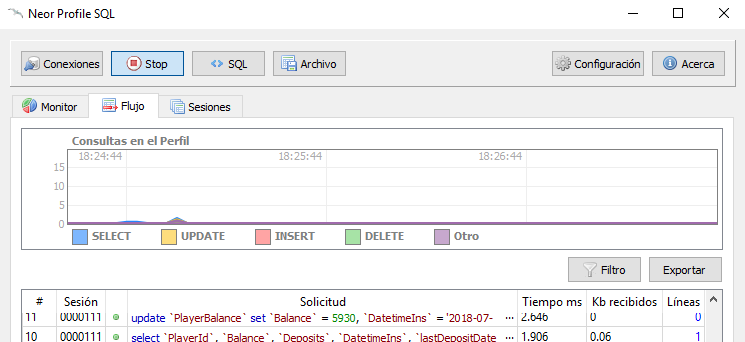
Using Neor Profiler SQL, is excellent! and the application is free for all users. https://www.profilesql.com/download/ image of query flow

Lipid answered 19/9, 2018 at 23:28 Comment(4)
I am trying to use it on my ubuntu, but it's not even connecting to mysql.Yearround
It seems like a good application even if it has not been updated for a long time, but I don't understand how to visualize the queries that are executed. Top graph seems ok but list of query remain empty. Neor Profiler SQL 4.1.1 on macOS Mojave 10.14.6 and mysql server 5.6.43 and 5.7.27-0ubuntu0.16.04.1Vitkun
With MySql 8 need to use a user with the old native password authentication.Archaeozoic
please update the link for this post, the provided link is pointing to a Chinese website. it's worthy to check out MySQL WorkBench 8, it has a lot of good features to profile your MySQL instances with easy to use GUI for reporting and exporting.Automation
S
8

Try JET profiler is a real-time query performance and diagnostics tool! I use it in my work. Excellent software and support. Review Jet Profiler for MySQL

Seventeen answered 9/12, 2010 at 15:10 Comment(3)
a old product. was used by me and saved my life but not today.Cholecalciferol
This answer obsolete as the referenced website is not related to MySQL anymoreClavate
Don't click on the link, the website isn't about MySQL anymore. (It's a Chinese website with Chinese content)Vandervelde
E
8

In my opinion I've found everything here in raw....

Find and open your MySQL configuration file, usually /etc/mysql/my.cnf on Ubuntu. Look for the section that says “Logging and Replication”

# * Logging and Replication
# Both location gets rotated by the cronjob.
# Be aware that this log type is a performance killer.

log = /var/log/mysql/mysql.log

or in newer versions of mysql, comment OUT this lines of codes

general_log_file        = /var/log/mysql/mysql.log
general_log             = 1
log_error                = /var/log/mysql/error.log

Just uncomment the “log” variable to turn on logging. Restart MySQL with this command: sudo /etc/init.d/mysql restart

Now we’re ready to start monitoring the queries as they come in. Open up a new terminal and run this command to scroll the log file, adjusting the path if necessary.

tail -f /var/log/mysql/mysql.log
Emmet answered 31/1, 2013 at 22:22 Comment(2)
People are reporting that this doesn't work in the latest version, and use: general_log = on general_log_file=/path/to/query.log instead which I found over at #6479607Darfur
Configuration file location on windows (xampp installation): mysql\bin\my.ini Just in case anyone else is looking for this.Ladin
B
5

Not sure about graphical user interface but there is a command that has helped me profile stored procedures a lot in MySQL using workbench:

SET profiling = 1;
call your_procedure;
SHOW PROFILES;
SET profiling = 0;
Beeler answered 17/5, 2017 at 13:48 Comment(0)
I
4

Jet Profiler is good if it's a paid version. The LogMonitor just point it to the mysql log file.

Inadvertency answered 27/1, 2010 at 23:21 Comment(0)
O
2

If version 5.0.37 isn't available, you might want to look at mytop. It simply outputs the current status of the server, but allows you to run EXPLAIN as (mentioned by mercutio) on particular queries.

Outwash answered 21/8, 2008 at 19:47 Comment(0)
E
0

I don't know about any profiling apps as such, but it's commonplace to use the EXPLAIN syntax for analysing queries. You can use these to figure out the best indexes to create, or you can try changing the overall query and see how it changes the efficiency, etc.

Electrodynamometer answered 21/8, 2008 at 15:43 Comment(0)

© 2022 - 2024 — McMap. All rights reserved.