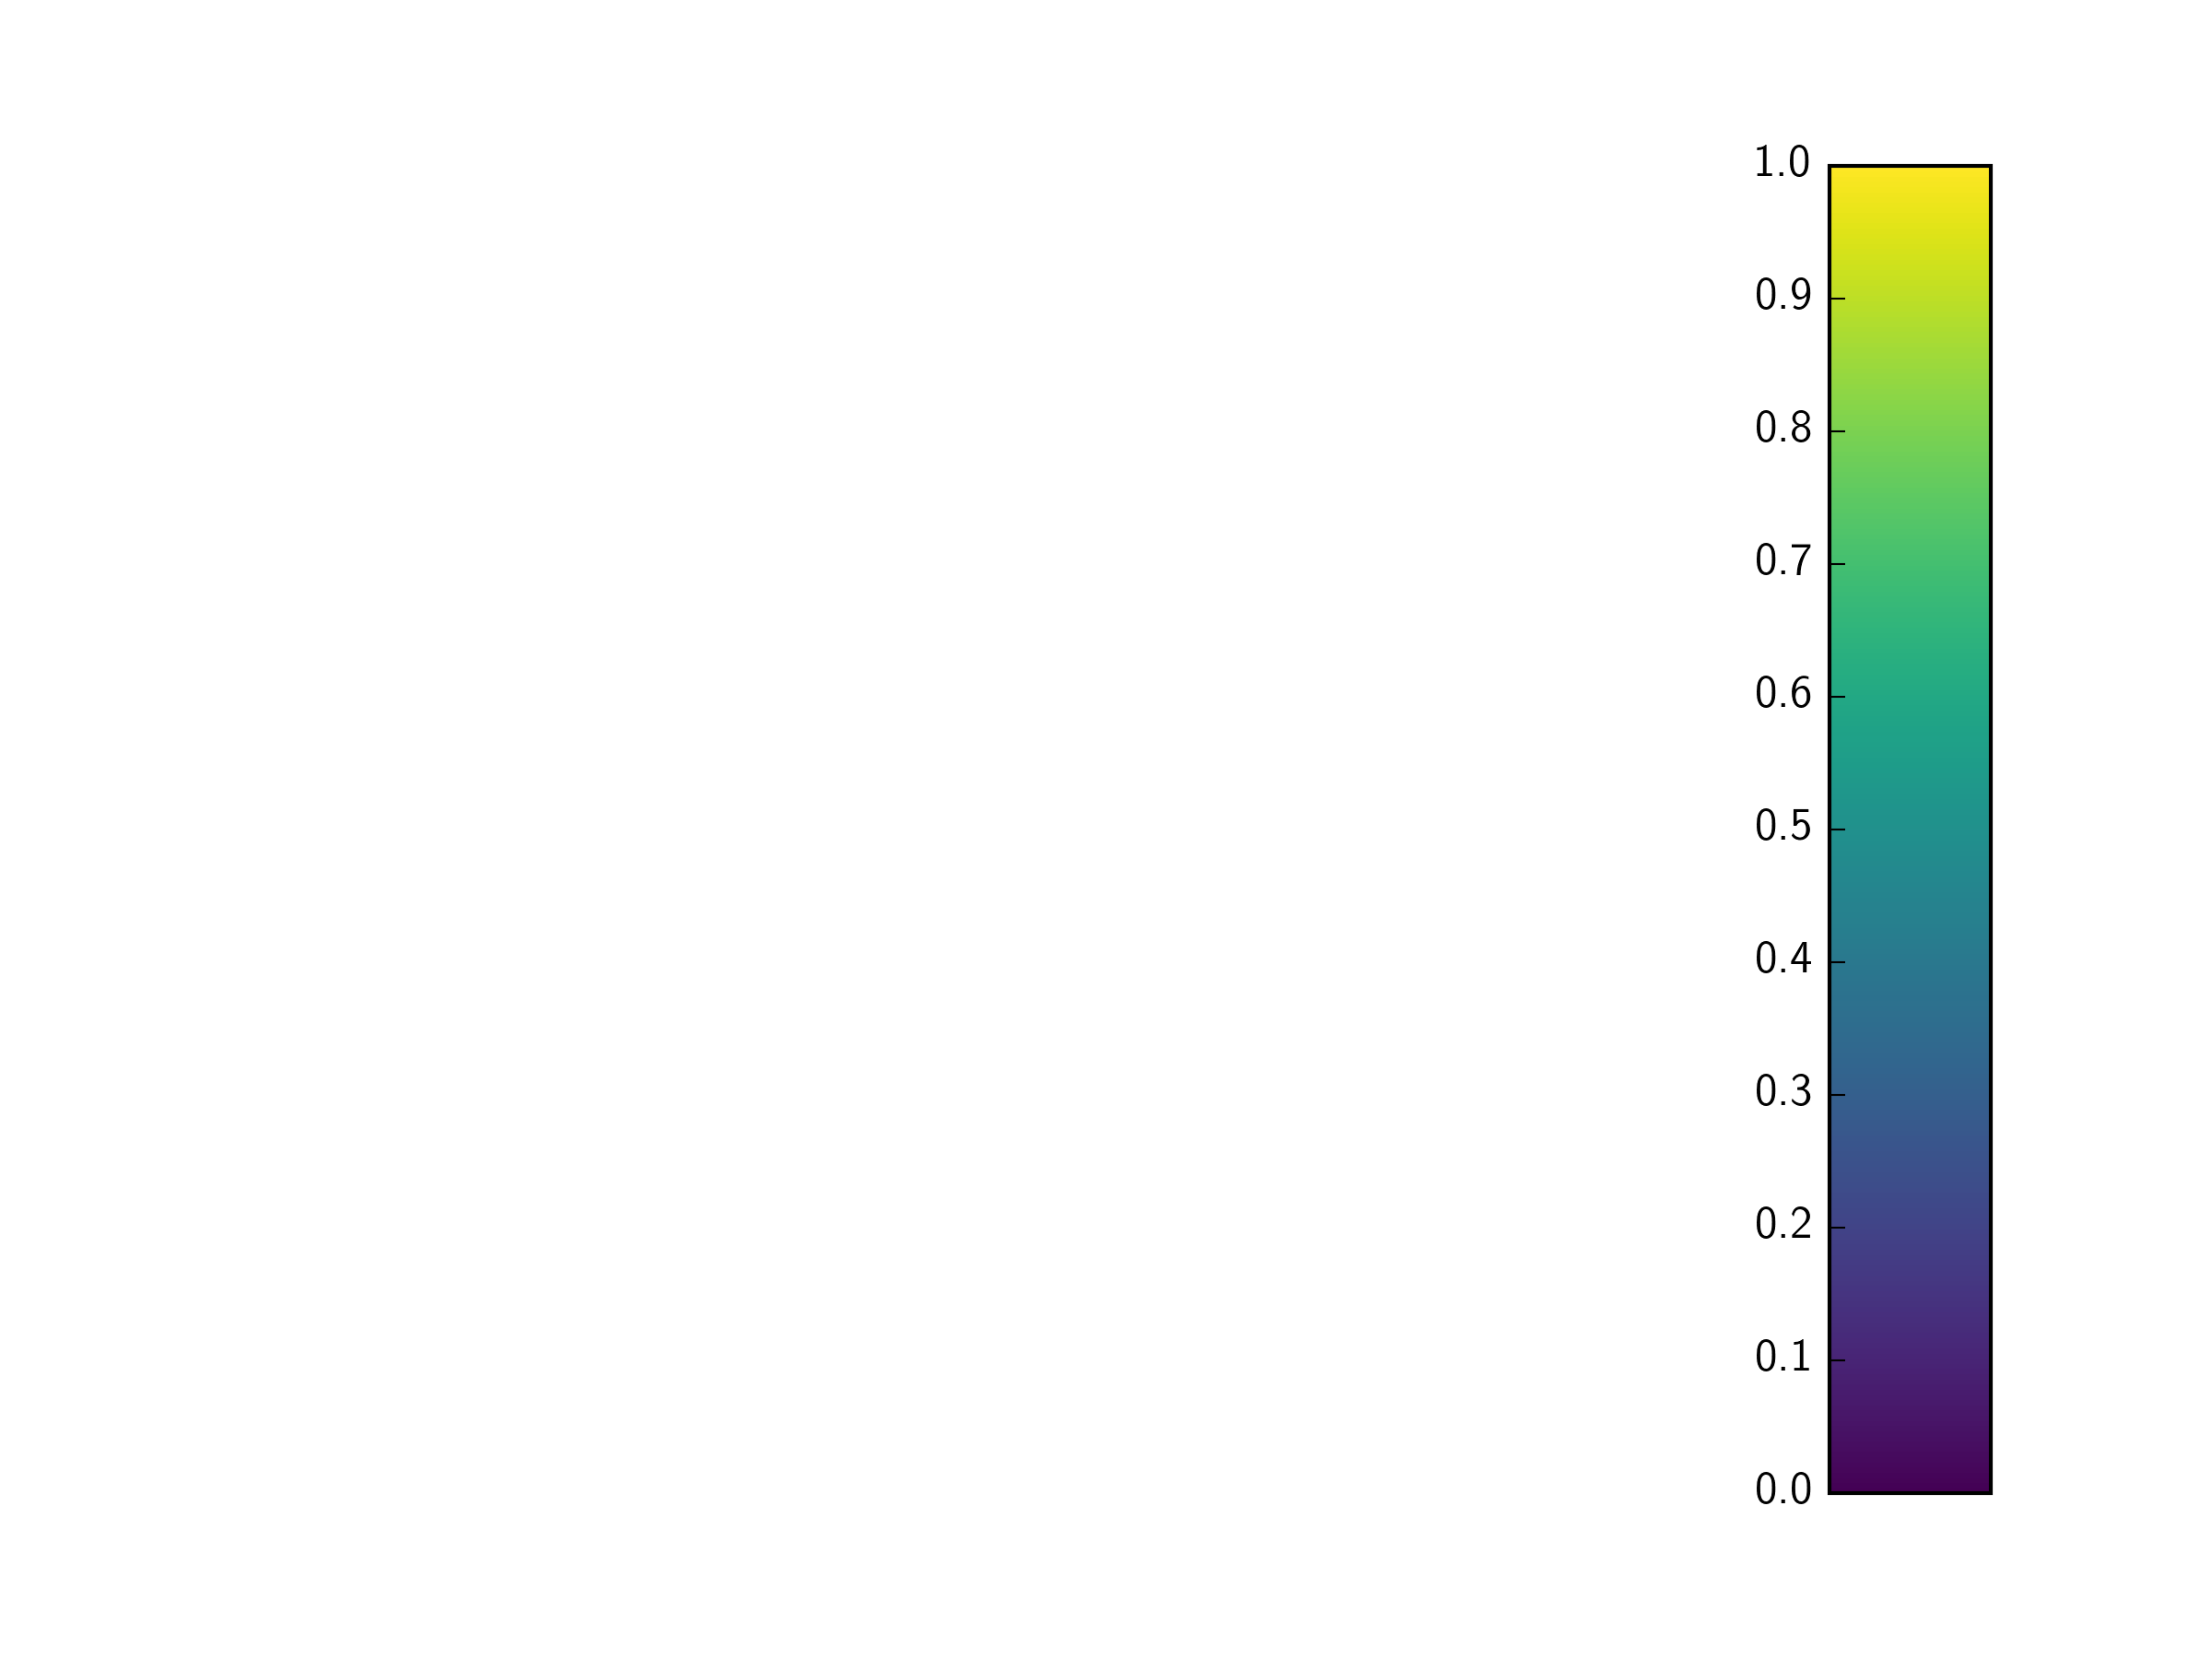
One could generate a vertical colorbar like so(simplified):
import matplotlib.pyplot as plt
import matplotlib as mpl

plt.figure()
c_ax=plt.subplot(111)
cb = mpl.colorbar.ColorbarBase(c_ax,orientation='vertical')
plt.savefig('my_colorbar.png')
Resulting in something like this(rotated for space reasons):
Is it possible to get the ticks labels on the opposite side?

