What are some useful tips/tools for monitoring/tuning memcached health?
Asked Answered
E

3

13

Yesterday, I found this cool script 'memcache-top' which nicely prints out stats of memcached live. It looks like,

memcache-top v0.6       (default port: 11211, color: on, refresh: 3 seconds)

INSTANCE                USAGE   HIT %   CONN    TIME    EVICT/s READ/s  WRITE/s
127.0.0.1:11211         88.8%   94.8%   20      0.8ms   9.0     311.3K  162.8K

AVERAGE:                88.8%   94.8%   20      0.8ms   9.0     311.3K  162.8K

TOTAL:          1.8GB/  2.0GB           20      0.8ms   9.0     311.3K  162.8K
(ctrl-c to quit.)

it even makes certain text red when you should pay attention to something!

Q. Broadly, what are some useful tools/techniques you've used to check that memcached is set up well?

Etka answered 19/4, 2013 at 17:19 Comment(0)
D
19

Good interface to accessing Memcached server instances is phpMemCacheAdmin.

I prefer access from the command line using telnet.

To make a connection to Memcached using Telnet, use the following telnet localhost 11211 command from the command line.

If at any time you wish to terminate the Telnet session, simply type quit and hit return.

You can get an overview of the important statistics of your Memcached server by running the stats command once connected.

Memory is allocated in chunks internally and constantly reused. Since memory is broken into different size slabs, you do waste memory if your items do not fit perfectly into the slab the server chooses to put it in.

So Memcached allocates your data into different "slabs" (think of these as partitions) of memory automatically, based on the size of your data, which in turn makes memory allocation more optimal.

To list the slabs in the instance you are connected to, use the stats slab command.

A more useful command is the stats items, which will give you a list of slabs which includes a count of the items store within each slab.

Now that you know how to list slabs, you can browse inside each slab to list the items contained within by using the stats cachedump [slab ID] [number of items, 0 for all items] command.

If you want to get the actual value of that item, you can use the get [key] command.

To delete an item from the cache you can use the delete [key] command.

Dianadiandra answered 23/4, 2013 at 0:33 Comment(0)
D
3

For a production systems, you should really set up active monitoring (with downtime alerts, automated restarts etc.) of Memcache using something like Monit. Here is an example config: Monitoring Memcache with Monit

Dollarfish answered 9/7, 2013 at 14:35 Comment(0)
B
0
  • It is good to monitor overall memory usage of memcached for resource planning.
  • Track the eviction statistics counter to know how often cached items are getting evicted due to lack of memory.

enter image description here

  • Track cache hit/misses, reclaims(The number of expired items removed to allow space for new writes), current connections, flush cmd which is available in stats.

  • Memcached stats (can be read from telnet, libmemcached, language specific library)

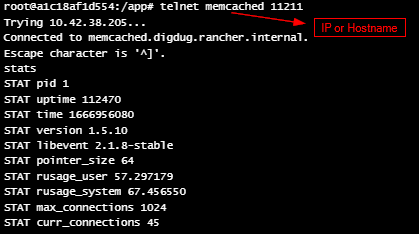
    • stats
    • stats slabs
    • stats items
    • stats sizes
    • stats detail
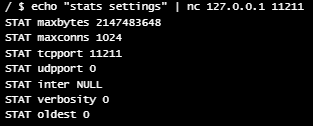
    • stats settings

run the above commands using telnet

enter image description here

or simply run using netcat

 echo "stats settings" | nc 127.0.0.1 11211

enter image description here

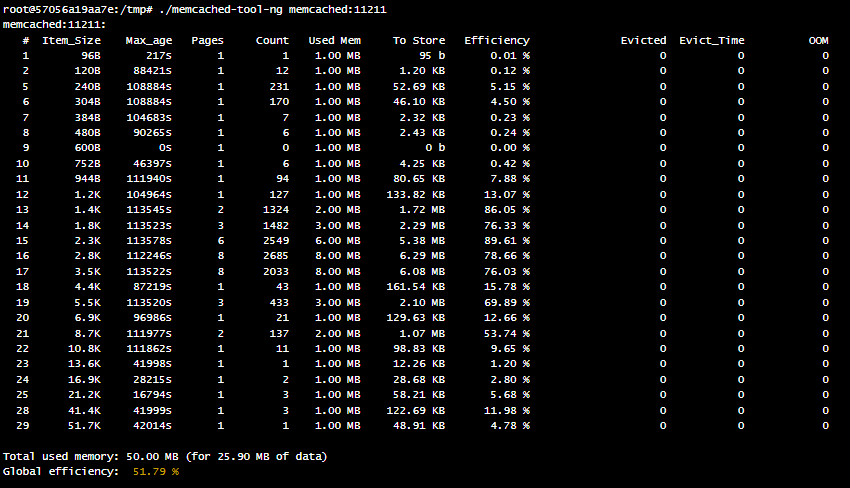
This is what memcached metrics per slab looks like

enter image description here

desc for some fields can be found here.

  • Memcached Prometheus exporter - Exports metrics from memcached servers for consumption by Prometheus.
Brit answered 28/10, 2022 at 11:50 Comment(0)

© 2022 - 2024 — McMap. All rights reserved.