How to rotate matplotlib annotation to match a line?
Asked Answered
C

4

31

Have a plot with several diagonal lines with different slopes. I would like to annotate these lines with a text label that matches the slope of the lines.

Something like this:

Annotated line

Is there a robust way to do this?

I've tried both text's and annotate's rotation parameters, but those are in screen coordinates, not data coordinates (i.e. it's always x degrees on the screen no matter the xy ranges). My x and y ranges differ by orders of magnitude, and obviously the apparent slope is affected by viewport size among other variables, so a fixed-degree rotation doesn't do the trick. Any other ideas?

Cantone answered 13/9, 2013 at 7:2 Comment(2)
I think someone already did that for you, and put an example in the matplotlib examples.Alvinalvina
@Evert I came across that before I asked this question. What that example does does not work for me. It's also completely uncommented in the one place it needs comments. I think it tries to get the data transform then do the rotation through that, but it's not clear that's right. The functions are poorly undocumented on matplotlib's APIs as well. Also, this approach does not handle a varying viewport, or one where you need to pack/resize after plotting the text. So it's not a robust solution.Cantone
O
11

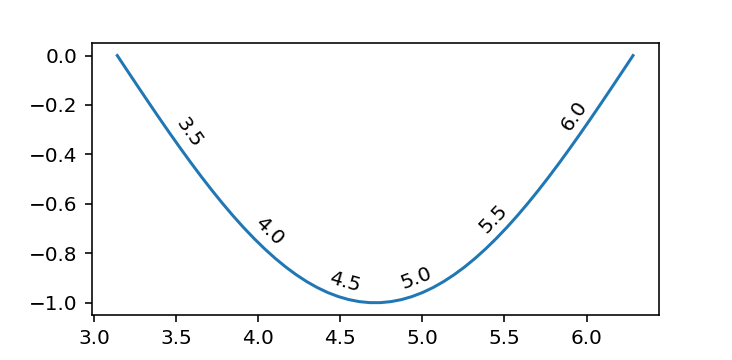
Even though this question is old, I keep coming across it and get frustrated, that it does not quite work. I reworked it into a class LineAnnotation and helper line_annotate such that it

  1. uses the slope at a specific point x,
  2. works with re-layouting and resizing, and
  3. accepts a relative offset perpendicular to the slope.
x = np.linspace(np.pi, 2*np.pi)
line, = plt.plot(x, np.sin(x))

for x in [3.5, 4.0, 4.5, 5.0, 5.5, 6.0]:
    line_annotate(str(x), line, x)

Annotated sinus

I originally put it into a public gist, but @Adam asked me to include it here.

import numpy as np
from matplotlib.text import Annotation
from matplotlib.transforms import Affine2D


class LineAnnotation(Annotation):
    """A sloped annotation to *line* at position *x* with *text*
    Optionally an arrow pointing from the text to the graph at *x* can be drawn.
    Usage
    -----
    fig, ax = subplots()
    x = linspace(0, 2*pi)
    line, = ax.plot(x, sin(x))
    ax.add_artist(LineAnnotation("text", line, 1.5))
    """

    def __init__(
        self, text, line, x, xytext=(0, 5), textcoords="offset points", **kwargs
    ):
        """Annotate the point at *x* of the graph *line* with text *text*.

        By default, the text is displayed with the same rotation as the slope of the
        graph at a relative position *xytext* above it (perpendicularly above).

        An arrow pointing from the text to the annotated point *xy* can
        be added by defining *arrowprops*.

        Parameters
        ----------
        text : str
            The text of the annotation.
        line : Line2D
            Matplotlib line object to annotate
        x : float
            The point *x* to annotate. y is calculated from the points on the line.
        xytext : (float, float), default: (0, 5)
            The position *(x, y)* relative to the point *x* on the *line* to place the
            text at. The coordinate system is determined by *textcoords*.
        **kwargs
            Additional keyword arguments are passed on to `Annotation`.

        See also
        --------
        `Annotation`
        `line_annotate`
        """
        assert textcoords.startswith(
            "offset "
        ), "*textcoords* must be 'offset points' or 'offset pixels'"

        self.line = line
        self.xytext = xytext

        # Determine points of line immediately to the left and right of x
        xs, ys = line.get_data()

        def neighbours(x, xs, ys, try_invert=True):
            inds, = np.where((xs <= x)[:-1] & (xs > x)[1:])
            if len(inds) == 0:
                assert try_invert, "line must cross x"
                return neighbours(x, xs[::-1], ys[::-1], try_invert=False)

            i = inds[0]
            return np.asarray([(xs[i], ys[i]), (xs[i+1], ys[i+1])])
        
        self.neighbours = n1, n2 = neighbours(x, xs, ys)
        
        # Calculate y by interpolating neighbouring points
        y = n1[1] + ((x - n1[0]) * (n2[1] - n1[1]) / (n2[0] - n1[0]))

        kwargs = {
            "horizontalalignment": "center",
            "rotation_mode": "anchor",
            **kwargs,
        }
        super().__init__(text, (x, y), xytext=xytext, textcoords=textcoords, **kwargs)

    def get_rotation(self):
        """Determines angle of the slope of the neighbours in display coordinate system
        """
        transData = self.line.get_transform()
        dx, dy = np.diff(transData.transform(self.neighbours), axis=0).squeeze()
        return np.rad2deg(np.arctan2(dy, dx))

    def update_positions(self, renderer):
        """Updates relative position of annotation text
        Note
        ----
        Called during annotation `draw` call
        """
        xytext = Affine2D().rotate_deg(self.get_rotation()).transform(self.xytext)
        self.set_position(xytext)
        super().update_positions(renderer)


def line_annotate(text, line, x, *args, **kwargs):
    """Add a sloped annotation to *line* at position *x* with *text*

    Optionally an arrow pointing from the text to the graph at *x* can be drawn.

    Usage
    -----
    x = linspace(0, 2*pi)
    line, = ax.plot(x, sin(x))
    line_annotate("sin(x)", line, 1.5)

    See also
    --------
    `LineAnnotation`
    `plt.annotate`
    """
    ax = line.axes
    a = LineAnnotation(text, line, x, *args, **kwargs)
    if "clip_on" in kwargs:
        a.set_clip_path(ax.patch)
    ax.add_artist(a)
    return a
Outboard answered 6/11, 2020 at 0:8 Comment(5)
This is better. If you paste in the code here to make the answer complete then I'll mark it as accepted.Cantone
One downside of both our approaches is that since we specify a 1D offset the distance from the line to the text varies depending on slope of the tangent at the annotation point. A near horizontal line will have a larger gap than a near vertical line. Your method offers an implementation that could be extended to solve that. If xytext is not specified then compute it using a distance along the normal to the line.Cantone
@Cantone Re 1: Ok, I included the full code. Re 2: Note that a value of xytext = (1, 5) is understood as 5 points in the direction of the normal of the line and 1 point in parallel to the line.Hunker
@JonasHörsch line must be a graph with datapoints in increasing x order /:Korney
@Korney That was a simplifying choice for finding the neighbouring points on the line between which to put the annotation. I made a small modification which makes the solution more general.Hunker
A
14

New in matplotlib 3.4.0

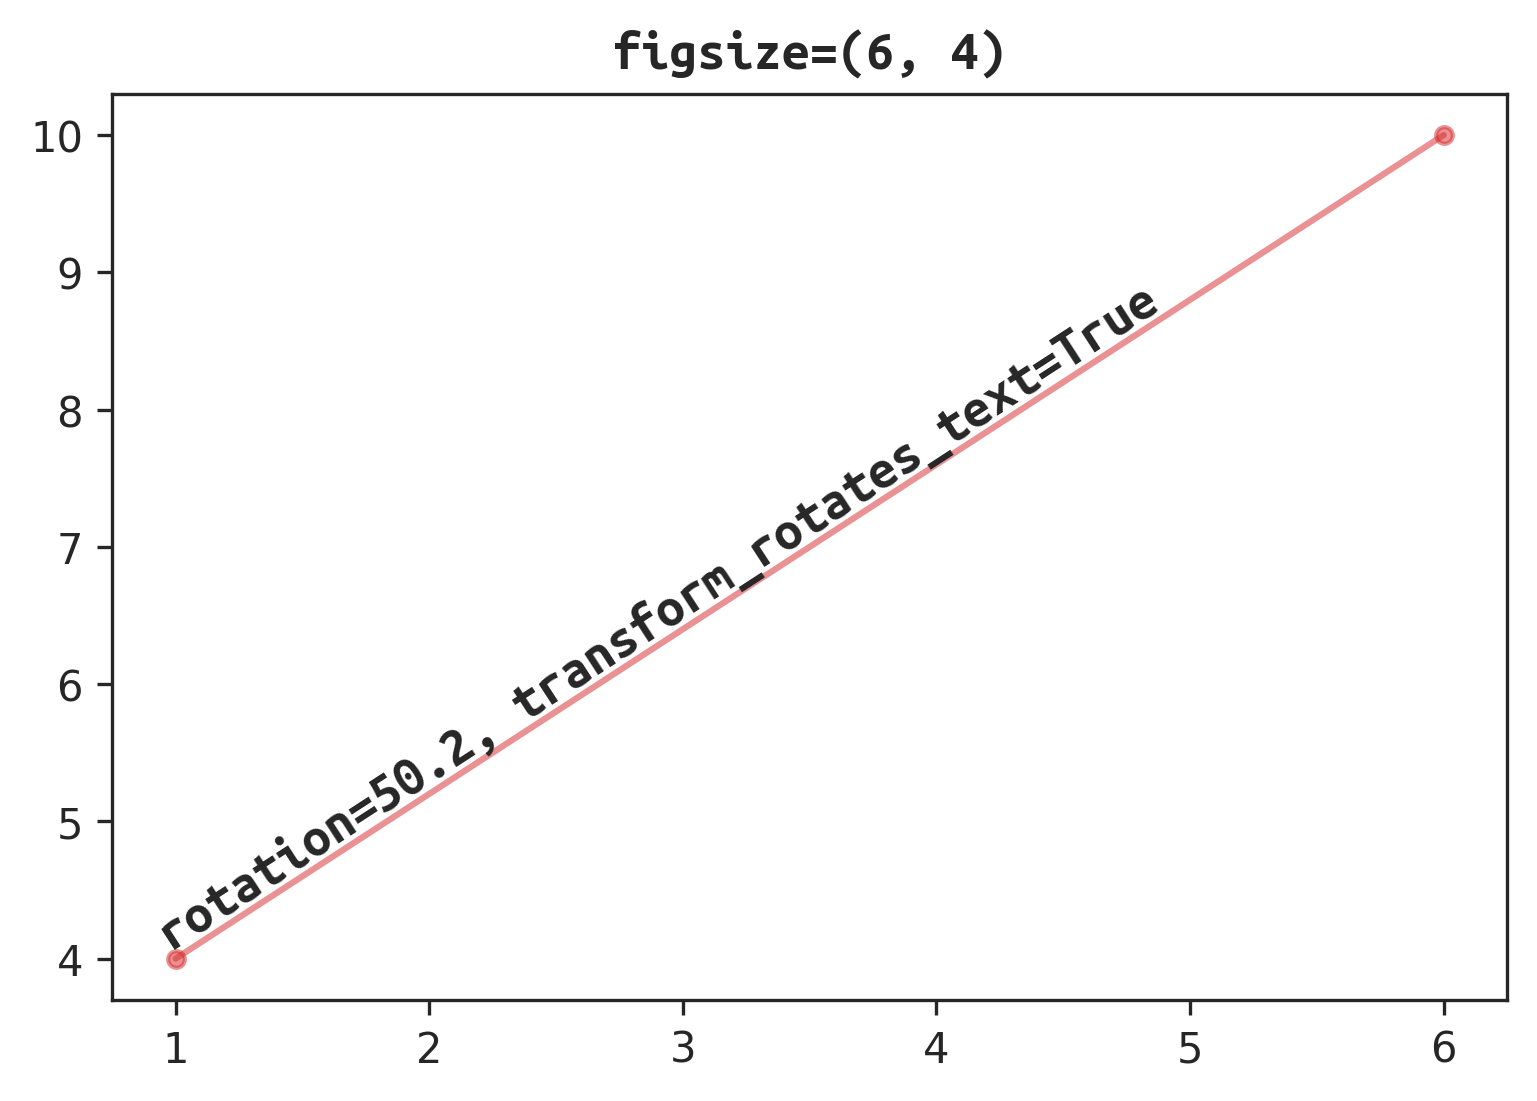
There is now a built-in parameter transform_rotates_text for rotating text relative to a line:

To rotate text with respect to a line, the correct angle won't be the angle of that line in the plot coordinate system, but the angle that the line appears in the screen coordinate system. This angle can be determined automatically by setting the new parameter transform_rotates_text.

So now we can just pass the raw data angle to plt.text and let matplotlib automatically transform it to the correct visual angle by setting transform_rotates_text=True:

# plot line from (1, 4) to (6, 10)
x = [1, 6]
y = [4, 10]
plt.plot(x, y, 'r.-')

# compute angle in raw data coordinates (no manual transforms)
dy = y[1] - y[0]
dx = x[1] - x[0]
angle = np.rad2deg(np.arctan2(dy, dx))

# annotate with transform_rotates_text to align text and line
plt.text(x[0], y[0], f'rotation={angle:.2f}', ha='left', va='bottom',
         transform_rotates_text=True, rotation=angle, rotation_mode='anchor')

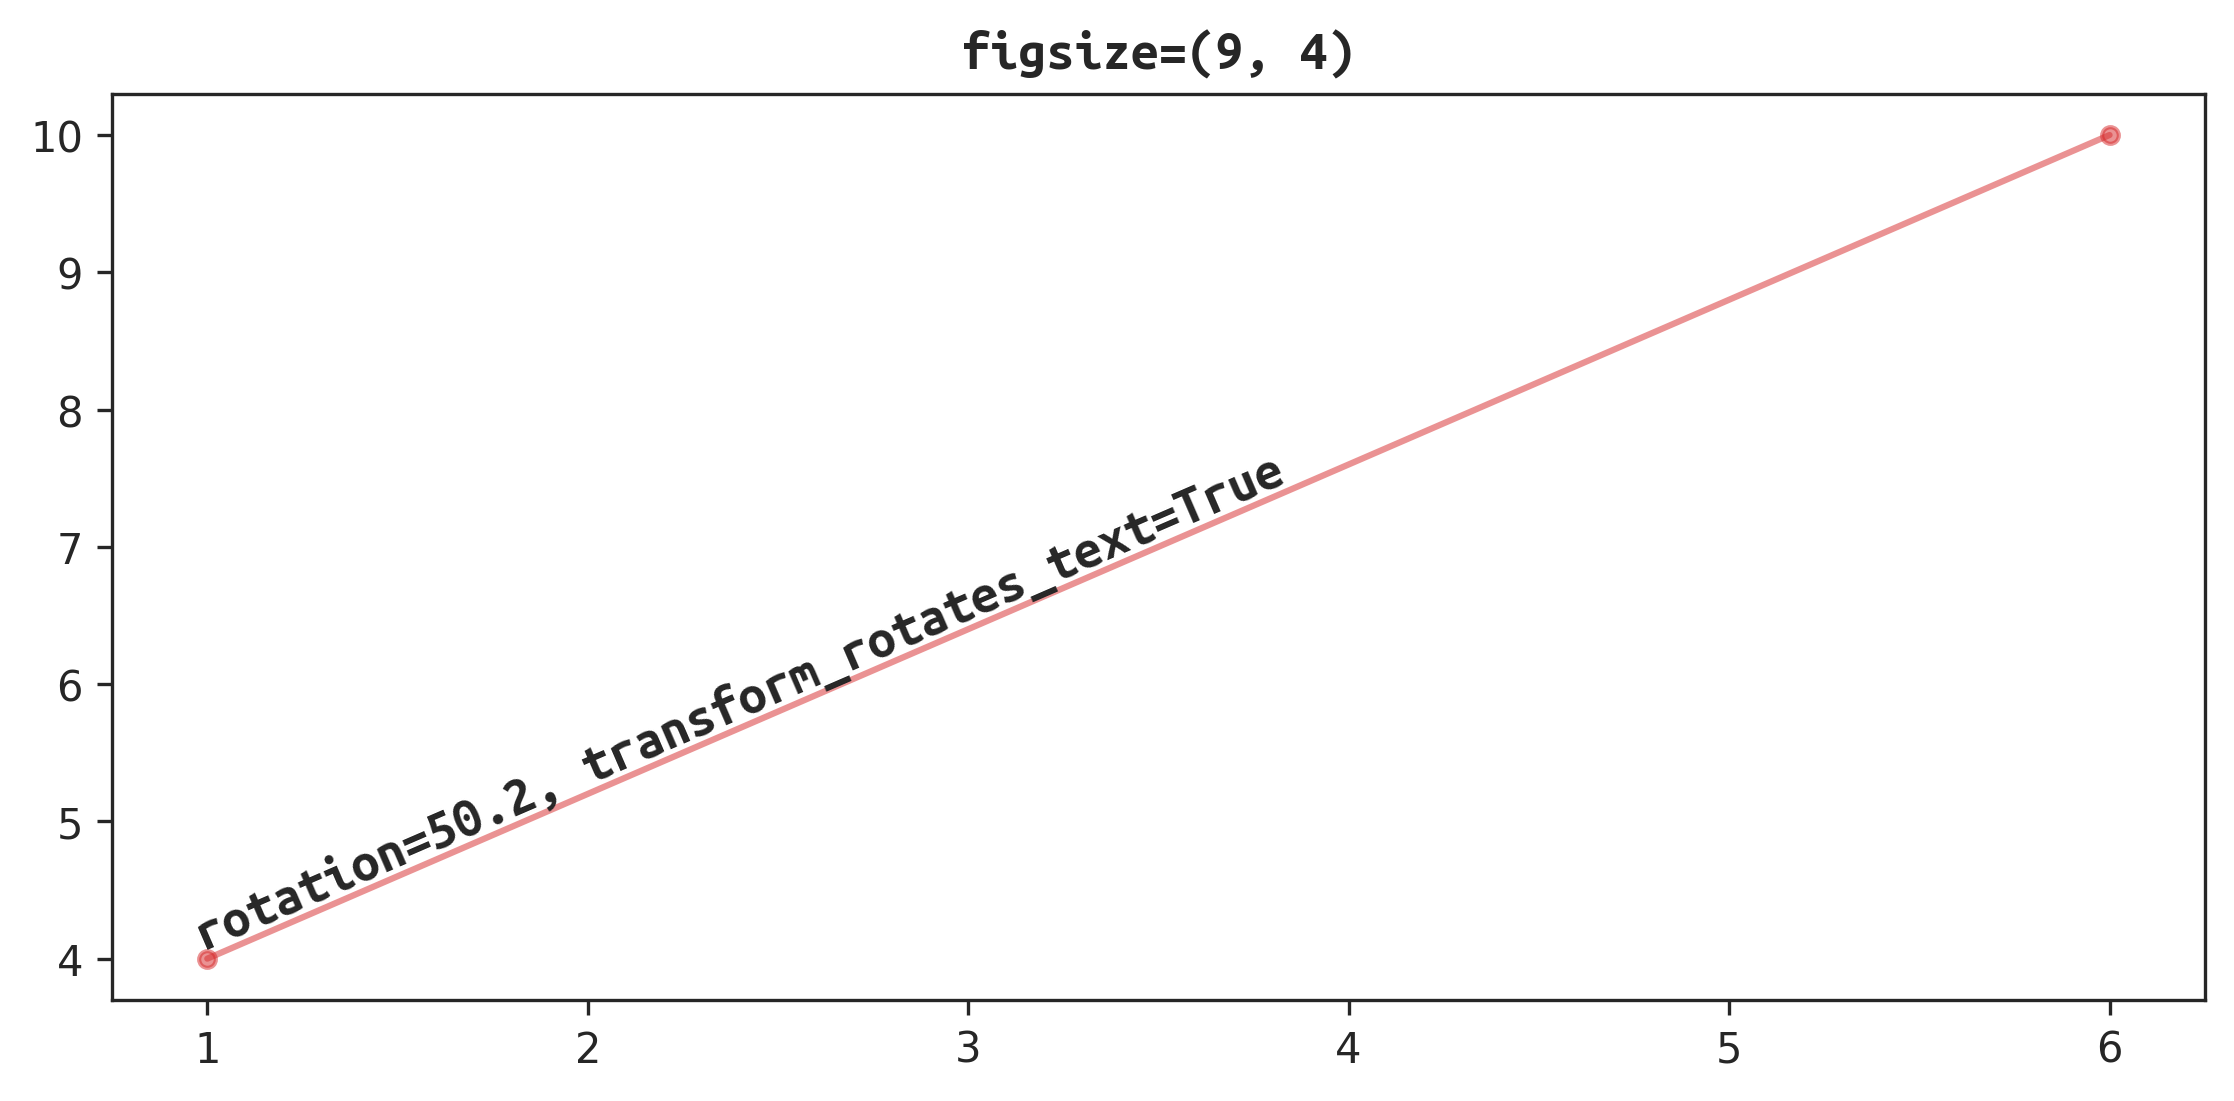
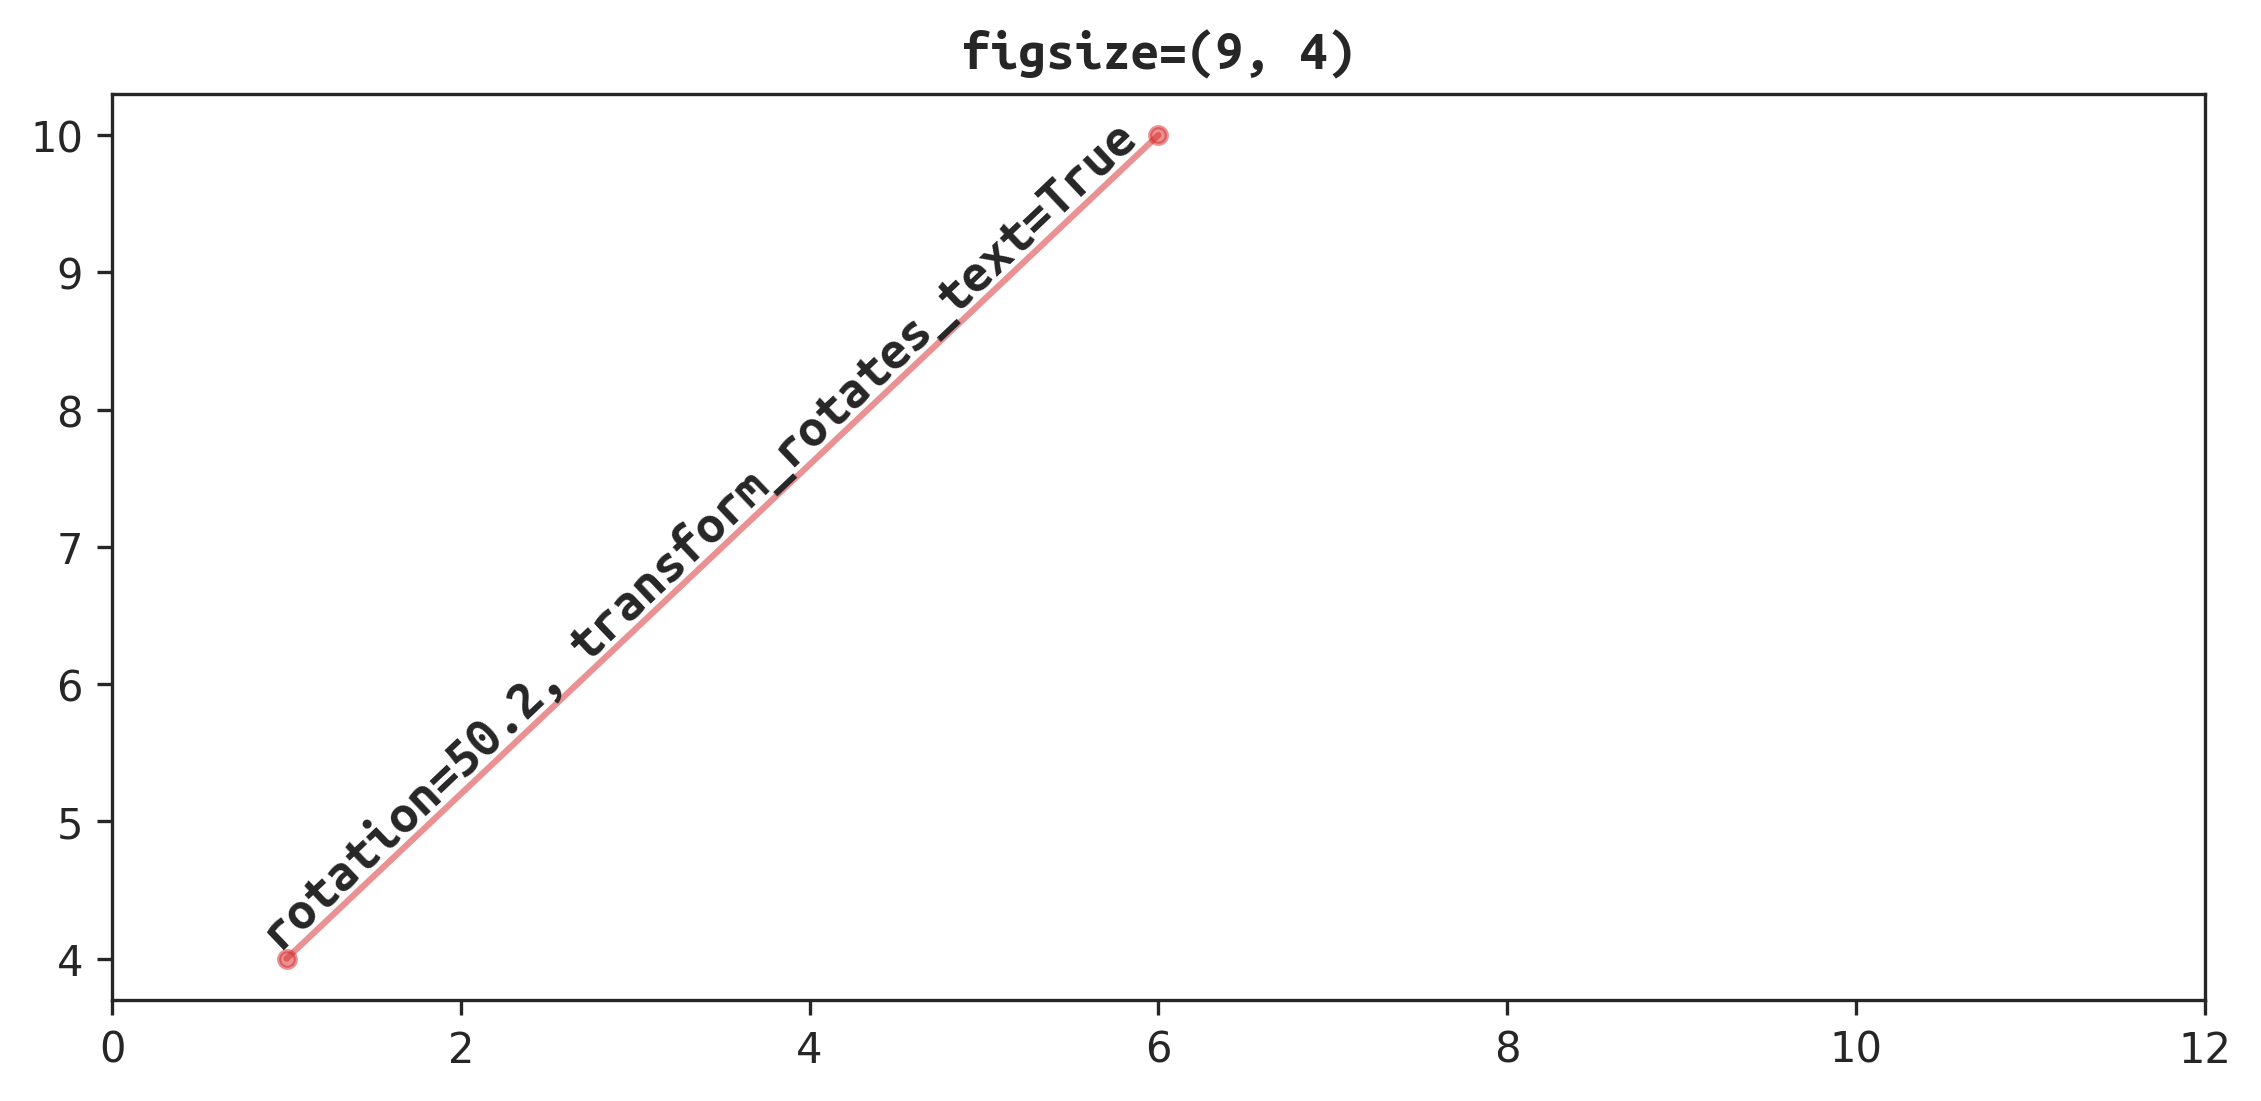
This approach is robust against the figure and axes scales. Even if we modify the figsize or xlim after placing the text, the rotation stays properly aligned:

# resizing the figure won't mess up the rotation
plt.gcf().set_size_inches(9, 4)

# rescaling the axes won't mess up the rotation
plt.xlim(0, 12)

Acidimetry answered 22/2, 2022 at 6:0 Comment(4)
I wasn't aware of this new feature. Thanks for pointing it out.Hunker
Any idea how to add an offset to get a text upper to the line ?Sauer
It can be done with use of shapely. right = line.parallel_offset(10, 'right') plt.text(right.boundary.geoms[1].xy[0][0], right.boundary.geoms[1].xy[1][0], ...Sauer
this is now by far the best answer!Nazarius
C
13

I came up with something that works for me. Note the grey dashed lines:

annotated lines

The rotation must be set manually, but this must be done AFTER draw() or layout. So my solution is to associate lines with annotations, then iterate through them and do this:

  1. get line's data transform (i.e. goes from data coordinates to display coordinates)
  2. transform two points along the line to display coordinates
  3. find slope of displayed line
  4. set text rotation to match this slope

This isn't perfect, because matplotlib's handling of rotated text is all wrong. It aligns by the bounding box and not by the text baseline.

Some font basics if you're interested about text rendering: http://docs.oracle.com/javase/tutorial/2d/text/fontconcepts.html

This example shows what matplotlib does: http://matplotlib.org/examples/pylab_examples/text_rotation.html

The only way I found to have a label properly next to the line is to align by center in both vertical and horizontal. I then offset the label by 10 points to the left to make it not overlap. Good enough for my application.

Here is my code. I draw the line however I want, then draw the annotation, then bind them with a helper function:

line, = fig.plot(xdata, ydata, '--', color=color)

# x,y appear on the midpoint of the line

t = fig.annotate("text", xy=(x, y), xytext=(-10, 0), textcoords='offset points', horizontalalignment='left', verticalalignment='bottom', color=color)
text_slope_match_line(t, x, y, line)

Then call another helper function after layout but before savefig (For interactive images I think you'll have to register for draw events and call update_text_slopes in the handler)

plt.tight_layout()
update_text_slopes()

The helpers:

rotated_labels = []
def text_slope_match_line(text, x, y, line):
    global rotated_labels

    # find the slope
    xdata, ydata = line.get_data()

    x1 = xdata[0]
    x2 = xdata[-1]
    y1 = ydata[0]
    y2 = ydata[-1]

    rotated_labels.append({"text":text, "line":line, "p1":numpy.array((x1, y1)), "p2":numpy.array((x2, y2))})

def update_text_slopes():
    global rotated_labels

    for label in rotated_labels:
        # slope_degrees is in data coordinates, the text() and annotate() functions need it in screen coordinates
        text, line = label["text"], label["line"]
        p1, p2 = label["p1"], label["p2"]

        # get the line's data transform
        ax = line.get_axes()

        sp1 = ax.transData.transform_point(p1)
        sp2 = ax.transData.transform_point(p2)

        rise = (sp2[1] - sp1[1])
        run = (sp2[0] - sp1[0])

        slope_degrees = math.degrees(math.atan(rise/run))

        text.set_rotation(slope_degrees)
Cantone answered 14/9, 2013 at 9:19 Comment(1)
I think I improved the alignment a little bit by using verticalalignment='center_baseline', and then xytext=(0,0). See gist.github.com/lzkelley/0de9e8bf2a4fe96d2018f1b1bd5a0d3cMariellemariellen
M
13

This is the exact same process and basic code as given by @Adam --- it's just restructured to be (hopefully) a little more convenient.

def label_line(line, label, x, y, color='0.5', size=12):
    """Add a label to a line, at the proper angle.

    Arguments
    ---------
    line : matplotlib.lines.Line2D object,
    label : str
    x : float
        x-position to place center of text (in data coordinated
    y : float
        y-position to place center of text (in data coordinates)
    color : str
    size : float
    """
    xdata, ydata = line.get_data()
    x1 = xdata[0]
    x2 = xdata[-1]
    y1 = ydata[0]
    y2 = ydata[-1]

    ax = line.get_axes()
    text = ax.annotate(label, xy=(x, y), xytext=(-10, 0),
                       textcoords='offset points',
                       size=size, color=color,
                       horizontalalignment='left',
                       verticalalignment='bottom')

    sp1 = ax.transData.transform_point((x1, y1))
    sp2 = ax.transData.transform_point((x2, y2))

    rise = (sp2[1] - sp1[1])
    run = (sp2[0] - sp1[0])

    slope_degrees = np.degrees(np.arctan2(rise, run))
    text.set_rotation(slope_degrees)
    return text

Used like:

import numpy as np
import matplotlib.pyplot as plt

...
fig, axes = plt.subplots()
color = 'blue'
line, = axes.plot(xdata, ydata, '--', color=color)
...
label_line(line, "Some Label", x, y, color=color)

Edit: note that this method still needs to be called after the figure layout is finalized, otherwise things will be altered.

See: https://gist.github.com/lzkelley/0de9e8bf2a4fe96d2018f1b1bd5a0d3c

Mariellemariellen answered 16/7, 2016 at 19:4 Comment(4)
This is much cleaner, but note that anything that redoes the layout, such as calling tight_layout() or resizing an interactive window, will result in an incorrect rotation angle. That's the reason I split mine into two functions, so the angle is computed after layout.Cantone
@Adam, thanks - yeah, I understand. In my implementations I'd rather just call the whole thing right before the end, instead of modifying one aspect right before the end. Thanks for emphasizing this point though.Mariellemariellen
@Adam. Thanks for both these answers. It has helped me. Now, follow up question from my side. In my case, I have lines with opposite slopes. With the present version, my text ends up upside down when the slope is negative. Any suggestion on how to make this piece of code more robust?Brasca
@Brasca I'm not sure what "opposite slope" means, but I'm guessing that the reason is that my code assumes the points are specified left to right and yours happen to be right to left. Just check for that condition and reverse the points if it's so.Cantone
O
11

Even though this question is old, I keep coming across it and get frustrated, that it does not quite work. I reworked it into a class LineAnnotation and helper line_annotate such that it

  1. uses the slope at a specific point x,
  2. works with re-layouting and resizing, and
  3. accepts a relative offset perpendicular to the slope.
x = np.linspace(np.pi, 2*np.pi)
line, = plt.plot(x, np.sin(x))

for x in [3.5, 4.0, 4.5, 5.0, 5.5, 6.0]:
    line_annotate(str(x), line, x)

Annotated sinus

I originally put it into a public gist, but @Adam asked me to include it here.

import numpy as np
from matplotlib.text import Annotation
from matplotlib.transforms import Affine2D


class LineAnnotation(Annotation):
    """A sloped annotation to *line* at position *x* with *text*
    Optionally an arrow pointing from the text to the graph at *x* can be drawn.
    Usage
    -----
    fig, ax = subplots()
    x = linspace(0, 2*pi)
    line, = ax.plot(x, sin(x))
    ax.add_artist(LineAnnotation("text", line, 1.5))
    """

    def __init__(
        self, text, line, x, xytext=(0, 5), textcoords="offset points", **kwargs
    ):
        """Annotate the point at *x* of the graph *line* with text *text*.

        By default, the text is displayed with the same rotation as the slope of the
        graph at a relative position *xytext* above it (perpendicularly above).

        An arrow pointing from the text to the annotated point *xy* can
        be added by defining *arrowprops*.

        Parameters
        ----------
        text : str
            The text of the annotation.
        line : Line2D
            Matplotlib line object to annotate
        x : float
            The point *x* to annotate. y is calculated from the points on the line.
        xytext : (float, float), default: (0, 5)
            The position *(x, y)* relative to the point *x* on the *line* to place the
            text at. The coordinate system is determined by *textcoords*.
        **kwargs
            Additional keyword arguments are passed on to `Annotation`.

        See also
        --------
        `Annotation`
        `line_annotate`
        """
        assert textcoords.startswith(
            "offset "
        ), "*textcoords* must be 'offset points' or 'offset pixels'"

        self.line = line
        self.xytext = xytext

        # Determine points of line immediately to the left and right of x
        xs, ys = line.get_data()

        def neighbours(x, xs, ys, try_invert=True):
            inds, = np.where((xs <= x)[:-1] & (xs > x)[1:])
            if len(inds) == 0:
                assert try_invert, "line must cross x"
                return neighbours(x, xs[::-1], ys[::-1], try_invert=False)

            i = inds[0]
            return np.asarray([(xs[i], ys[i]), (xs[i+1], ys[i+1])])
        
        self.neighbours = n1, n2 = neighbours(x, xs, ys)
        
        # Calculate y by interpolating neighbouring points
        y = n1[1] + ((x - n1[0]) * (n2[1] - n1[1]) / (n2[0] - n1[0]))

        kwargs = {
            "horizontalalignment": "center",
            "rotation_mode": "anchor",
            **kwargs,
        }
        super().__init__(text, (x, y), xytext=xytext, textcoords=textcoords, **kwargs)

    def get_rotation(self):
        """Determines angle of the slope of the neighbours in display coordinate system
        """
        transData = self.line.get_transform()
        dx, dy = np.diff(transData.transform(self.neighbours), axis=0).squeeze()
        return np.rad2deg(np.arctan2(dy, dx))

    def update_positions(self, renderer):
        """Updates relative position of annotation text
        Note
        ----
        Called during annotation `draw` call
        """
        xytext = Affine2D().rotate_deg(self.get_rotation()).transform(self.xytext)
        self.set_position(xytext)
        super().update_positions(renderer)


def line_annotate(text, line, x, *args, **kwargs):
    """Add a sloped annotation to *line* at position *x* with *text*

    Optionally an arrow pointing from the text to the graph at *x* can be drawn.

    Usage
    -----
    x = linspace(0, 2*pi)
    line, = ax.plot(x, sin(x))
    line_annotate("sin(x)", line, 1.5)

    See also
    --------
    `LineAnnotation`
    `plt.annotate`
    """
    ax = line.axes
    a = LineAnnotation(text, line, x, *args, **kwargs)
    if "clip_on" in kwargs:
        a.set_clip_path(ax.patch)
    ax.add_artist(a)
    return a
Outboard answered 6/11, 2020 at 0:8 Comment(5)
This is better. If you paste in the code here to make the answer complete then I'll mark it as accepted.Cantone
One downside of both our approaches is that since we specify a 1D offset the distance from the line to the text varies depending on slope of the tangent at the annotation point. A near horizontal line will have a larger gap than a near vertical line. Your method offers an implementation that could be extended to solve that. If xytext is not specified then compute it using a distance along the normal to the line.Cantone
@Cantone Re 1: Ok, I included the full code. Re 2: Note that a value of xytext = (1, 5) is understood as 5 points in the direction of the normal of the line and 1 point in parallel to the line.Hunker
@JonasHörsch line must be a graph with datapoints in increasing x order /:Korney
@Korney That was a simplifying choice for finding the neighbouring points on the line between which to put the annotation. I made a small modification which makes the solution more general.Hunker

© 2022 - 2024 — McMap. All rights reserved.