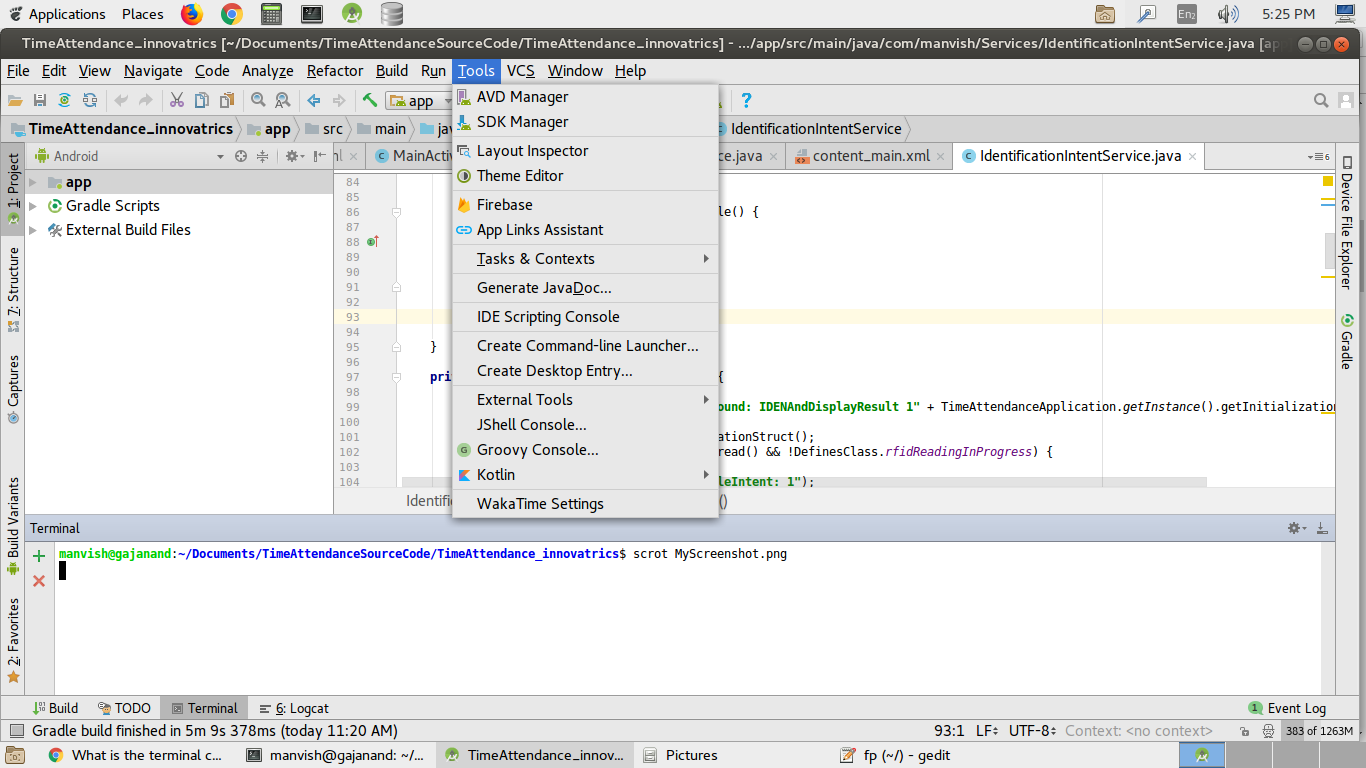
Recently I updated my android studio, after the update, I am unable to find android device monitor option in the tools section. In the previous update it was there in tools->android->android device monitor. But now in the updated version, it is not present. You can check screenshot of my android studio.
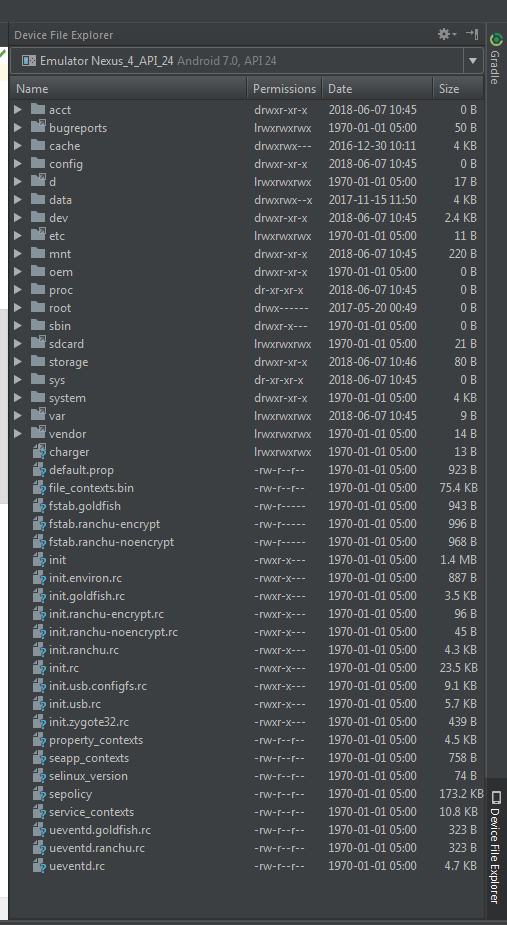
If you want to push or pull your files from devices monitor now android studio offers something better then android monitor. Just take a look at right side of your studio there is an option device file explorer. Open it and you are good to go. Select your device from top dropdown and rest of everything is pretty much the same as it was in android monitor. Below is the screen Shot attached to give you the exact location and idea.
Now you can use device file explorer instead of device monitor. Go to
view > tool windows > device file explorer
screenshot: opening device file explorer in android studio 3.1.3
More details
- Click View > Tool Windows > Device File Explorer or click the Device File Explorer button in the tool window bar to open the Device File Explorer.
- Select a device from the drop down list.
- Interact with the device content in the file explorer window. Right-click on a file or directory to create a new file or directory, save the selected file or directory to your machine, upload, delete, or synchronize. Double-click a file to open it in Android Studio.
Android Studio saves files you open this way in a temporary directory outside of your project. If you make modifications to a file you opened using the Device File Explorer, and would like to save your changes back to the device, you must manually upload the modified version of the file to the device.
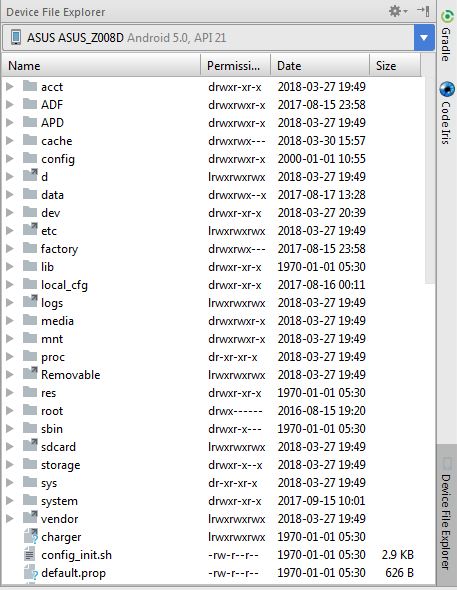
screenshot: The Device File Explorer tool window
When exploring a device's files, the following directories are particularly useful:
data/data/app_name/
Contains data files for your app stored on internal storage
sdcard/
Contains user files stored on external user storage (pictures, etc.)
Note: Not all files on a hardware device are visible in the Device File Explorer. For example, in the data/data/ directory, entries corresponding to apps on the device that are not debuggable cannot be expanded in the Device File Explorer.
To start the standalone Device Monitor application, enter the following on the command line in the android-sdk/tools/ directory:
monitor
You can then link the tool to a connected device by selecting the device from the Devices pane. If you have trouble viewing panes or windows, select Window > Reset Perspective from the menu bar.
- Note: Each device can be attached to only one debugger process at a time. So, for example, if you are using Android Studio to debug your app on a device, you need to disconnect the Android Studio debugger from the device before you attach a debugger process from the Android Device Monitor.
reference : https://developer.android.com/studio/profile/monitor.html
=> You Can change minSdkVersion 16 And open Device File Explorer
- Device File Explorer work same as a Android Device Monitor
See Below Image:
From Android Studio 3.1 Device Monitor available from the command line only.
In Android Studio 3.1, the Device Monitor serves less of a role than it previously did. In many cases, the functionality available through the Device Monitor is now provided by new and improved tools.
See the Device Monitor documentation for instructions for invoking the Device Monitor from the command line and for details of the tools available through the Device Monitor.
To start the standalone Device Monitor application, enter the following on the command line in the android-sdk/tools/ directory:
monitor
To start the standalone Device Monitor application, enter the following on the command line in the android-sdk/tools/ directory:
monitor
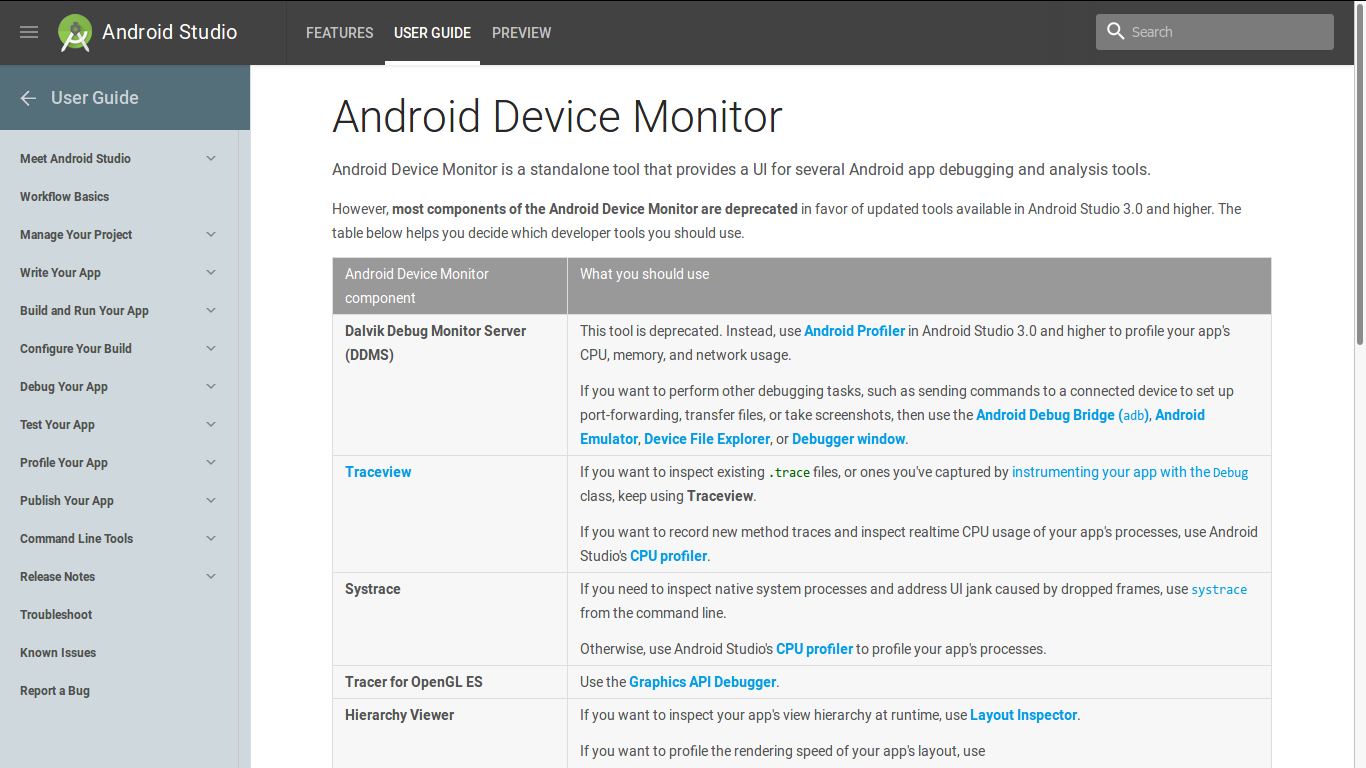
But remember Most of the Android Device Monitor componenets are deprecated after 3.0 For detail info visit this link
To get it to work I had to switch to Java 8 from Java 10 (In my system PATH variable) then go to
C:\Users\Alex\AppData\Local\Android\Sdk\tools\lib\monitor-x86_64 and run monitor.exe.
As said in "Testing the game on your Android device", I followed these three steps
- With the game still running on your device, return to your computer.
- Navigate to the directory containing the Android SDK Tools.
- Navigate to tools and double click the application called monitor.
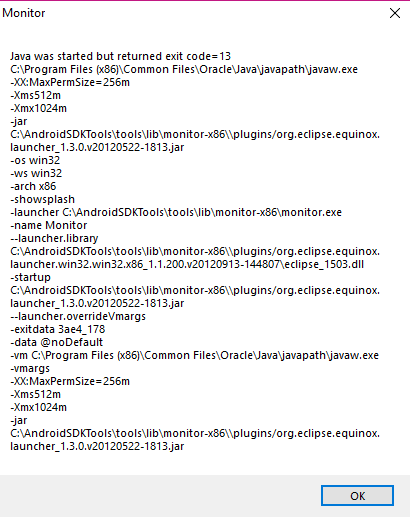
This was prompting the following error
I've also tested using cmd and the same error persisted
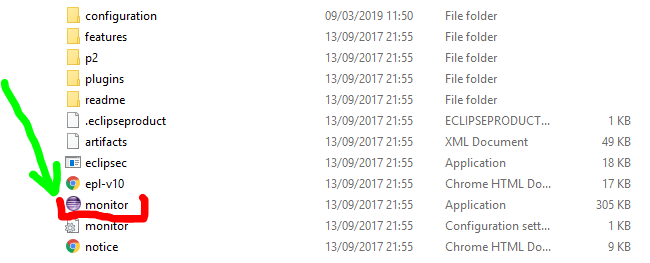
To fix it, I had to go to AndroidSDKTools\tools\lib\monitor-x86_64 and double click in the monitor application
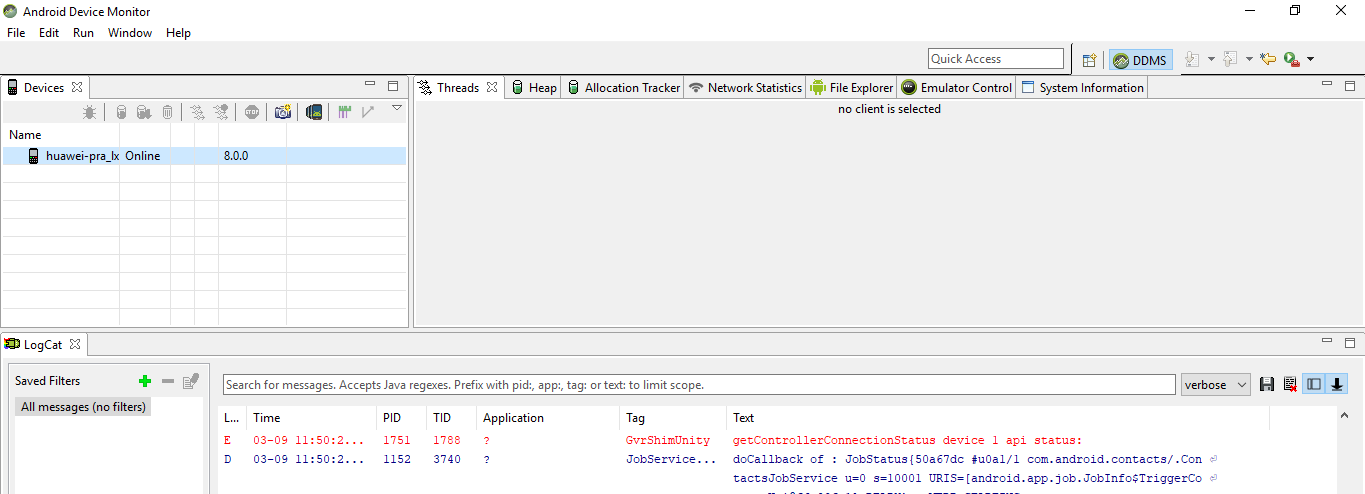
And then the Android Device Manager just started as normal
You still can run it from File explorer on Windows 10 with the proper path. You just need to go to C:\Users\user\AppData\Local\Android\Sdk\tools\lib\monitor-x86_64 and double click the file monitor.
If you want to use in the cmd just the 'monitor' command you have to add this folder (in my case with android studio 3.4.1 and win10) to your Environment variables. So, press the start button and then type Edit the system environment variabes click it and System properties window should open. Then go to
Environment variables => System variables => path
press the Edit button for path and add the new value
C:\Users\user\AppData\Local\Android\Sdk\tools\lib\monitor-x86_64
click 'Ok', 'Ok' and 'Ok' and restart the cmd window if you had it opened and type 'monitor' and it should open the monitor as well.
Hope it helps!
PD: This answer was based on this answer https://mcmap.net/q/235494/-how-to-open-android-device-monitor-in-latest-android-studio-3-1 from Tiago Martins Peres
ADM was deprecated in 3.1 version of android studio and removed from Android Studio 3.2. Android Device Monitor have been replaced by new features and to start Android Device Monitor application in android studio 3.1 and lower, following the commend line android-sdk/tools/ directory:
monitor
If you're looking for the Hierarchy Viewer tool, it has been changed to Layout Inspector:
https://developer.android.com/studio/debug/layout-inspector.html
Android Device Monitor was deprecated in Android Studio 3.1 and removed from Android Studio 3.2
Use Android Profiler introduced in Android Studio 3.0 to measure the cpu utilisation, network, memory etc,. To open Android Profiler: View -> Tool Windows -> Profiler.
Android Device Monitor has been replaced by some new feature which you can find here.
According to developer docs, it's deprecated now. Please follow these docs: developer link
On Android Studio 3.1 and above, you can push photos to the emulator, by first starting the emulator. Then select “Device File Explorer” from the menu at the top of the screen: View/Tool Window/Device File Explorer Then look in the folder titled “sdcard” and you will see a folder titled “Pictures”, click on it. Then right click it and select “Upload” and navigate to the photo on your computer, to the photo you would like to push onto the emulator. The restart the emulator. See photo below: example of uploading a photo to emulator
© 2022 - 2024 — McMap. All rights reserved.

