What is a stack trace, and how can I use it to debug my application errors?
Asked Answered
C

7

792

Sometimes when I run my application it gives me an error that looks like:

Exception in thread "main" java.lang.NullPointerException
        at com.example.myproject.Book.getTitle(Book.java:16)
        at com.example.myproject.Author.getBookTitles(Author.java:25)
        at com.example.myproject.Bootstrap.main(Bootstrap.java:14)

People have referred to this as a "stack trace". What is a stack trace? What can it tell me about the error that's happening in my program?


About this question - quite often I see a question come through where a novice programmer is "getting an error", and they simply paste their stack trace and some random block of code without understanding what the stack trace is or how they can use it. This question is intended as a reference for novice programmers who might need help understanding the value of a stack trace.

Chow answered 21/10, 2010 at 14:52 Comment(1)
Also, if a stacktrace line does not contain the filename and a line number, the class for that line was not compiled with debug information.Mohammedanism
C
753

In simple terms, a stack trace is a list of the method calls that the application was in the middle of when an Exception was thrown.

Simple Example

With the example given in the question, we can determine exactly where the exception was thrown in the application. Let's have a look at the stack trace:

Exception in thread "main" java.lang.NullPointerException
        at com.example.myproject.Book.getTitle(Book.java:16)
        at com.example.myproject.Author.getBookTitles(Author.java:25)
        at com.example.myproject.Bootstrap.main(Bootstrap.java:14)

This is a very simple stack trace. If we start at the beginning of the list of "at ...", we can tell where our error happened. What we're looking for is the topmost method call that is part of our application. In this case, it's:

at com.example.myproject.Book.getTitle(Book.java:16)

To debug this, we can open up Book.java and look at line 16, which is:

15   public String getTitle() {
16      System.out.println(title.toString());
17      return title;
18   }

This would indicate that something (probably title) is null in the above code.

Example with a chain of exceptions

Sometimes applications will catch an Exception and re-throw it as the cause of another Exception. This typically looks like:

34   public void getBookIds(int id) {
35      try {
36         book.getId(id);    // this method it throws a NullPointerException on line 22
37      } catch (NullPointerException e) {
38         throw new IllegalStateException("A book has a null property", e)
39      }
40   }

This might give you a stack trace that looks like:

Exception in thread "main" java.lang.IllegalStateException: A book has a null property
        at com.example.myproject.Author.getBookIds(Author.java:38)
        at com.example.myproject.Bootstrap.main(Bootstrap.java:14)
Caused by: java.lang.NullPointerException
        at com.example.myproject.Book.getId(Book.java:22)
        at com.example.myproject.Author.getBookIds(Author.java:36)
        ... 1 more

What's different about this one is the "Caused by". Sometimes exceptions will have multiple "Caused by" sections. For these, you typically want to find the "root cause", which will be one of the lowest "Caused by" sections in the stack trace. In our case, it's:

Caused by: java.lang.NullPointerException <-- root cause
        at com.example.myproject.Book.getId(Book.java:22) <-- important line

Again, with this exception we'd want to look at line 22 of Book.java to see what might cause the NullPointerException here.

More daunting example with library code

Usually stack traces are much more complex than the two examples above. Here's an example (it's a long one, but demonstrates several levels of chained exceptions):

javax.servlet.ServletException: Something bad happened
    at com.example.myproject.OpenSessionInViewFilter.doFilter(OpenSessionInViewFilter.java:60)
    at org.mortbay.jetty.servlet.ServletHandler$CachedChain.doFilter(ServletHandler.java:1157)
    at com.example.myproject.ExceptionHandlerFilter.doFilter(ExceptionHandlerFilter.java:28)
    at org.mortbay.jetty.servlet.ServletHandler$CachedChain.doFilter(ServletHandler.java:1157)
    at com.example.myproject.OutputBufferFilter.doFilter(OutputBufferFilter.java:33)
    at org.mortbay.jetty.servlet.ServletHandler$CachedChain.doFilter(ServletHandler.java:1157)
    at org.mortbay.jetty.servlet.ServletHandler.handle(ServletHandler.java:388)
    at org.mortbay.jetty.security.SecurityHandler.handle(SecurityHandler.java:216)
    at org.mortbay.jetty.servlet.SessionHandler.handle(SessionHandler.java:182)
    at org.mortbay.jetty.handler.ContextHandler.handle(ContextHandler.java:765)
    at org.mortbay.jetty.webapp.WebAppContext.handle(WebAppContext.java:418)
    at org.mortbay.jetty.handler.HandlerWrapper.handle(HandlerWrapper.java:152)
    at org.mortbay.jetty.Server.handle(Server.java:326)
    at org.mortbay.jetty.HttpConnection.handleRequest(HttpConnection.java:542)
    at org.mortbay.jetty.HttpConnection$RequestHandler.content(HttpConnection.java:943)
    at org.mortbay.jetty.HttpParser.parseNext(HttpParser.java:756)
    at org.mortbay.jetty.HttpParser.parseAvailable(HttpParser.java:218)
    at org.mortbay.jetty.HttpConnection.handle(HttpConnection.java:404)
    at org.mortbay.jetty.bio.SocketConnector$Connection.run(SocketConnector.java:228)
    at org.mortbay.thread.QueuedThreadPool$PoolThread.run(QueuedThreadPool.java:582)
Caused by: com.example.myproject.MyProjectServletException
    at com.example.myproject.MyServlet.doPost(MyServlet.java:169)
    at javax.servlet.http.HttpServlet.service(HttpServlet.java:727)
    at javax.servlet.http.HttpServlet.service(HttpServlet.java:820)
    at org.mortbay.jetty.servlet.ServletHolder.handle(ServletHolder.java:511)
    at org.mortbay.jetty.servlet.ServletHandler$CachedChain.doFilter(ServletHandler.java:1166)
    at com.example.myproject.OpenSessionInViewFilter.doFilter(OpenSessionInViewFilter.java:30)
    ... 27 more
Caused by: org.hibernate.exception.ConstraintViolationException: could not insert: [com.example.myproject.MyEntity]
    at org.hibernate.exception.SQLStateConverter.convert(SQLStateConverter.java:96)
    at org.hibernate.exception.JDBCExceptionHelper.convert(JDBCExceptionHelper.java:66)
    at org.hibernate.id.insert.AbstractSelectingDelegate.performInsert(AbstractSelectingDelegate.java:64)
    at org.hibernate.persister.entity.AbstractEntityPersister.insert(AbstractEntityPersister.java:2329)
    at org.hibernate.persister.entity.AbstractEntityPersister.insert(AbstractEntityPersister.java:2822)
    at org.hibernate.action.EntityIdentityInsertAction.execute(EntityIdentityInsertAction.java:71)
    at org.hibernate.engine.ActionQueue.execute(ActionQueue.java:268)
    at org.hibernate.event.def.AbstractSaveEventListener.performSaveOrReplicate(AbstractSaveEventListener.java:321)
    at org.hibernate.event.def.AbstractSaveEventListener.performSave(AbstractSaveEventListener.java:204)
    at org.hibernate.event.def.AbstractSaveEventListener.saveWithGeneratedId(AbstractSaveEventListener.java:130)
    at org.hibernate.event.def.DefaultSaveOrUpdateEventListener.saveWithGeneratedOrRequestedId(DefaultSaveOrUpdateEventListener.java:210)
    at org.hibernate.event.def.DefaultSaveEventListener.saveWithGeneratedOrRequestedId(DefaultSaveEventListener.java:56)
    at org.hibernate.event.def.DefaultSaveOrUpdateEventListener.entityIsTransient(DefaultSaveOrUpdateEventListener.java:195)
    at org.hibernate.event.def.DefaultSaveEventListener.performSaveOrUpdate(DefaultSaveEventListener.java:50)
    at org.hibernate.event.def.DefaultSaveOrUpdateEventListener.onSaveOrUpdate(DefaultSaveOrUpdateEventListener.java:93)
    at org.hibernate.impl.SessionImpl.fireSave(SessionImpl.java:705)
    at org.hibernate.impl.SessionImpl.save(SessionImpl.java:693)
    at org.hibernate.impl.SessionImpl.save(SessionImpl.java:689)
    at sun.reflect.GeneratedMethodAccessor5.invoke(Unknown Source)
    at sun.reflect.DelegatingMethodAccessorImpl.invoke(DelegatingMethodAccessorImpl.java:25)
    at java.lang.reflect.Method.invoke(Method.java:597)
    at org.hibernate.context.ThreadLocalSessionContext$TransactionProtectionWrapper.invoke(ThreadLocalSessionContext.java:344)
    at $Proxy19.save(Unknown Source)
    at com.example.myproject.MyEntityService.save(MyEntityService.java:59) <-- relevant call (see notes below)
    at com.example.myproject.MyServlet.doPost(MyServlet.java:164)
    ... 32 more
Caused by: java.sql.SQLException: Violation of unique constraint MY_ENTITY_UK_1: duplicate value(s) for column(s) MY_COLUMN in statement [...]
    at org.hsqldb.jdbc.Util.throwError(Unknown Source)
    at org.hsqldb.jdbc.jdbcPreparedStatement.executeUpdate(Unknown Source)
    at com.mchange.v2.c3p0.impl.NewProxyPreparedStatement.executeUpdate(NewProxyPreparedStatement.java:105)
    at org.hibernate.id.insert.AbstractSelectingDelegate.performInsert(AbstractSelectingDelegate.java:57)
    ... 54 more

In this example, there's a lot more. What we're mostly concerned about is looking for methods that are from our code, which would be anything in the com.example.myproject package. From the second example (above), we'd first want to look down for the root cause, which is:

Caused by: java.sql.SQLException

However, all the method calls under that are library code. So we'll move up to the "Caused by" above it, and in that "Caused by" block, look for the first method call originating from our code, which is:

at com.example.myproject.MyEntityService.save(MyEntityService.java:59)

Like in previous examples, we should look at MyEntityService.java on line 59, because that's where this error originated (this one's a bit obvious what went wrong, since the SQLException states the error, but the debugging procedure is what we're after).

Chow answered 21/10, 2010 at 14:52 Comment(5)
Suggested improvement: explain the the first line of a stack trace which starts with Exception in thread "main" in your first example. I think It would be especially helpful to explain that this line is often accompanied by a message, such as the value of a variable, that can help diagnose the problem. I attempted to make an edit myself, but I'm struggling to fit these ideas into the existing structure of your answer.Jaela
Also java 1.7 added "Suppressed: " - which lists suppressed exceptions stack traces before displaying "Caused by:" for this exception. It's automatically used by try-with-resource construct: docs.oracle.com/javase/specs/jls/se8/html/… and contains exceptions if any that was thrown during the resource(s) closure.Aigneis
There is a JEP openjdk.java.net/jeps/8220715 that aims to further improve the comprehensibility of especially NPEs by providing details like "Cannot write field 'nullInstanceField' because 'this.nullInstanceField' is null."Cucumber
@Cucumber This shipped in Java 14. There will be a lot of good things in Java 17 as compared to Java 11 LTS, so hopefully it will be the new baseline for development.Mohammedanism
@RobHruska, it would be nice if you add the 'line 22' actual code into the answer, so reader can reason it a bit better. otherwise Book.getId(Book.java:22) have to be imagined.Demijohn
M
100

What is a Stacktrace?

A stacktrace is a very helpful debugging tool. It shows the call stack (meaning, the stack of functions that were called up to that point) at the time an uncaught exception was thrown (or the time the stacktrace was generated manually). This is very useful because it doesn't only show you where the error happened, but also how the program ended up in that place of the code. This leads over to the next question:

What is an Exception?

An Exception is what the runtime environment uses to tell you that an error occurred. Popular examples are NullPointerException, IndexOutOfBoundsException or ArithmeticException. Each of these are caused when you try to do something that is not possible. For example, a NullPointerException will be thrown when you try to dereference a Null-object:

Object a = null;
a.toString();                 //this line throws a NullPointerException

Object[] b = new Object[5];
System.out.println(b[10]);    //this line throws an IndexOutOfBoundsException,
                              //because b is only 5 elements long
int ia = 5;
int ib = 0;
ia = ia/ib;                   //this line throws an  ArithmeticException with the 
                              //message "/ by 0", because you are trying to
                              //divide by 0, which is not possible.

How should I deal with Stacktraces/Exceptions?

At first, find out what is causing the Exception. Try googling the name of the exception to find out what the cause of that exception is. Most of the time it will be caused by incorrect code. In the given examples above, all of the exceptions are caused by incorrect code. So for the NullPointerException example you could make sure that a is never null at that time. You could, for example, initialise a or include a check like this one:

if (a!=null) {
    a.toString();
}

This way, the offending line is not executed if a==null. Same goes for the other examples.

Sometimes you can't make sure that you don't get an exception. For example, if you are using a network connection in your program, you cannot stop the computer from loosing it's internet connection (e.g. you can't stop the user from disconnecting the computer's network connection). In this case the network library will probably throw an exception. Now you should catch the exception and handle it. This means, in the example with the network connection, you should try to reopen the connection or notify the user or something like that. Also, whenever you use catch, always catch only the exception you want to catch, do not use broad catch statements like catch (Exception e) that would catch all exceptions. This is very important, because otherwise you might accidentally catch the wrong exception and react in the wrong way.

try {
    Socket x = new Socket("1.1.1.1", 6789);
    x.getInputStream().read()
} catch (IOException e) {
    System.err.println("Connection could not be established, please try again later!")
}

Why should I not use catch (Exception e)?

Let's use a small example to show why you should not just catch all exceptions:

int mult(Integer a,Integer b) {
    try {
        int result = a/b
        return result;
    } catch (Exception e) {
        System.err.println("Error: Division by zero!");
        return 0;
    }
}

What this code is trying to do is to catch the ArithmeticException caused by a possible division by 0. But it also catches a possible NullPointerException that is thrown if a or b are null. This means, you might get a NullPointerException but you'll treat it as an ArithmeticException and probably do the wrong thing. In the best case you still miss that there was a NullPointerException. Stuff like that makes debugging much harder, so don't do that.

TLDR

  1. Figure out what is the cause of the exception and fix it, so that it doesn't throw the exception at all.
  2. If 1. is not possible, catch the specific exception and handle it.
    • Never just add a try/catch and then just ignore the exception! Don't do that!
    • Never use catch (Exception e), always catch specific Exceptions. That will save you a lot of headaches.
Mid answered 14/10, 2015 at 10:40 Comment(3)
The one I meant has been deleted by now, as far as I know. It basically said "just put a try{} catch(Exception e){} and ignore all errors". The accepted answer is a lot older than my answer so I was aiming to give a little bit of a different view on the matter. I don't think it helps anyone to just copy someone else's answer or to cover what other people already covered well.Mid
It's misleading to say "Do not catch exception", that's only one use case. Your example is great, but how about where you are at the top of your thread loop (inside run)? You should ALWAYS catch exception (or maybe Throwable) there and log it so that it doesn't invisibly vanish (Exceptions thrown from run generally aren't logged correctly unless you've set up your thread/logger to do so).Offspring
I didn't include this special case since it only matters with multithreading. In single threading a leaked exception kills the program and is logged visibly. If someone does not know how to handle exceptions properly, they usually don't know how to use multithreading yet either.Mid
J
24

To add on to what Rob has mentioned. Setting break points in your application allows for the step-by-step processing of the stack. This enables the developer to use the debugger to see at what exact point the method is doing something that was unanticipated.

Since Rob has used the NullPointerException (NPE) to illustrate something common, we can help to remove this issue in the following manner:

if we have a method that takes parameters such as: void (String firstName)

In our code we would want to evaluate that firstName contains a value, we would do this like so: if(firstName == null || firstName.equals("")) return;

The above prevents us from using firstName as an unsafe parameter. Therefore by doing null checks before processing we can help to ensure that our code will run properly. To expand on an example that utilizes an object with methods we can look here:

if(dog == null || dog.firstName == null) return;

The above is the proper order to check for nulls, we start with the base object, dog in this case, and then begin walking down the tree of possibilities to make sure everything is valid before processing. If the order were reversed a NPE could potentially be thrown and our program would crash.

Jampack answered 21/10, 2010 at 15:5 Comment(2)
Agreed. This approach could be used to find out which reference in a statement is null when a NullPointerException is being examined, for example.Chow
When dealing with String, if you want to use equals method I think it´s better to use the constant in the left side of the comparation, like this: Instead of: if(firstName == null || firstName.equals("")) return; I always use: if(("").equals(firstName)) This prevents the Nullpointer exceptionBolanos
L
21

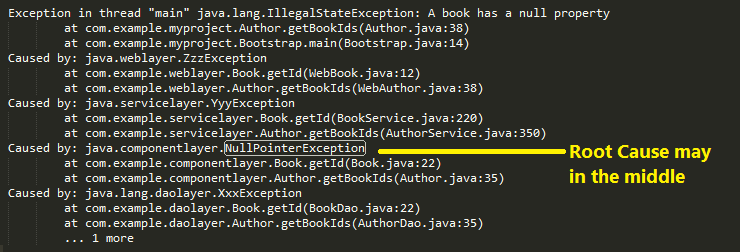
To understand the name: A stack trace is a a list of Exceptions( or you can say a list of "Cause by"), from the most surface Exception(e.g. Service Layer Exception) to the deepest one (e.g. Database Exception). Just like the reason we call it 'stack' is because stack is First in Last out (FILO), the deepest exception was happened in the very beginning, then a chain of exception was generated a series of consequences, the surface Exception was the last one happened in time, but we see it in the first place.

Key 1:A tricky and important thing here need to be understand is : the deepest cause may not be the "root cause", because if you write some "bad code", it may cause some exception underneath which is deeper than its layer. For example, a bad sql query may cause SQLServerException connection reset in the bottem instead of syndax error, which may just in the middle of the stack.

-> Locate the root cause in the middle is your job. enter image description here

Key 2:Another tricky but important thing is inside each "Cause by" block, the first line was the deepest layer and happen first place for this block. For instance,

Exception in thread "main" java.lang.NullPointerException
        at com.example.myproject.Book.getTitle(Book.java:16)
           at com.example.myproject.Author.getBookTitles(Author.java:25)
               at com.example.myproject.Bootstrap.main(Bootstrap.java:14)

Book.java:16 was called by Auther.java:25 which was called by Bootstrap.java:14, Book.java:16 was the root cause. Here attach a diagram sort the trace stack in chronological order. enter image description here

Leptophyllous answered 26/7, 2016 at 2:24 Comment(0)
A
19

There is one more stacktrace feature offered by Throwable family - the possibility to manipulate stack trace information.

Standard behavior:

package test.stack.trace;

public class SomeClass {

    public void methodA() {
        methodB();
    }

    public void methodB() {
        methodC();
    }

    public void methodC() {
        throw new RuntimeException();
    }

    public static void main(String[] args) {
        new SomeClass().methodA();
    }
}

Stack trace:

Exception in thread "main" java.lang.RuntimeException
    at test.stack.trace.SomeClass.methodC(SomeClass.java:18)
    at test.stack.trace.SomeClass.methodB(SomeClass.java:13)
    at test.stack.trace.SomeClass.methodA(SomeClass.java:9)
    at test.stack.trace.SomeClass.main(SomeClass.java:27)

Manipulated stack trace:

package test.stack.trace;

public class SomeClass {

    ...

    public void methodC() {
        RuntimeException e = new RuntimeException();
        e.setStackTrace(new StackTraceElement[]{
                new StackTraceElement("OtherClass", "methodX", "String.java", 99),
                new StackTraceElement("OtherClass", "methodY", "String.java", 55)
        });
        throw e;
    }

    public static void main(String[] args) {
        new SomeClass().methodA();
    }
}

Stack trace:

Exception in thread "main" java.lang.RuntimeException
    at OtherClass.methodX(String.java:99)
    at OtherClass.methodY(String.java:55)
Alan answered 16/9, 2014 at 17:34 Comment(1)
I don't know how I feel about this...with the nature of the thread, I would advise new devs to not define their own stack trace.Gimbals
R
11

The other posts describe what a stack trace is, but it can still be hard to work with.

If you get a stack trace and want to trace the cause of the exception, a good start point in understanding it is to use the Java Stack Trace Console in Eclipse. If you use another IDE there may be a similar feature, but this answer is about Eclipse.

First, ensure that you have all of your Java sources accessible in an Eclipse project.

Then in the Java perspective, click on the Console tab (usually at the bottom). If the Console view is not visible, go to the menu option Window -> Show View and select Console.

Then in the console window, click on the following button (on the right)

Consoles button

and then select Java Stack Trace Console from the drop-down list.

Paste your stack trace into the console. It will then provide a list of links into your source code and any other source code available.

For example, if we had this program:

public class ExceptionTest {
    
    public static void main(String[] args) {
        int l = trimmedLength(null);
        System.out.println("Trimmed length = " + l);
    }
    
    private static int trimmedLength(String string) {
        return string.trim().length();
    }
}

You would get this stack trace:

Pasted stack trace

The most recent method call made (and the one that caused the exception) will be the top of the stack, which is the top line (excluding the error message text). In this case, that is the trimmedLength method. Going down the stack goes back in time. The second line is the method that calls the first line, etc.

If you are using open-source software, you might need to download and attach to your project the sources if you want to examine. Download the source jars, in your project, open the Referenced Libraries folder to find your jar for your open-source module (the one with the class files) then right click, select Properties and attach the source jar.

Rancho answered 12/3, 2015 at 9:34 Comment(0)
M
11

Just to add to the other examples, there are inner(nested) classes that appear with the $ sign. For example:

public class Test {

    private static void privateMethod() {
        throw new RuntimeException();
    }

    public static void main(String[] args) throws Exception {
        Runnable runnable = new Runnable() {
            @Override public void run() {
                privateMethod();
            }
        };
        runnable.run();
    }
}

Will result in this stack trace:

Exception in thread "main" java.lang.RuntimeException
        at Test.privateMethod(Test.java:4)
        at Test.access$000(Test.java:1)
        at Test$1.run(Test.java:10)
        at Test.main(Test.java:13)
Magdamagdaia answered 19/4, 2016 at 3:43 Comment(0)

© 2022 - 2024 — McMap. All rights reserved.