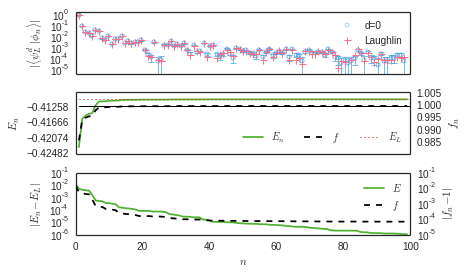
I have a complicated figure made in matplotlib with three subplots, two of which have twin axes. It works well except there are no tick marks in the figure and I can't figure out how to get them.
Here is the code and figure:
fig = plt.figure()
gs = gridspec.GridSpec(3, 1)
idx=0
n=len(d_10[idx])
fac=0.2

ax1=fig.add_subplot(gs[0,0])
ax1.errorbar(range(n),d_10[idx]["abs(Overlap)"][0:n],yerr=d_10[idx]["ErrOverlap"][0:n],ms=4,mew=0.7,marker="o",ls='none',elinewidth=0.7,capsize=3,fillstyle='none',color=qual_cp4[2])
ax1.plot([0],d_10[idx]["abs(Overlap)"][0],marker="o",ls='none',fillstyle='none',color=qual_cp4[2],ms=4,mew=0.4,label='d=0')
ax1.plot(range(n),np.sqrt(hc_10),marker="+",ls='none',color=qual_cp4[0],label='Laughlin')
ax1.axes.get_xaxis().set_ticklabels([])

plt.yscale('log', nonposy="clip")
plt.axis([-2,101,1e-5,1.2])
plt.legend(loc='upper right')
yl1=plt.ylabel(r'$|\langle\psi_L^d|\phi_n\rangle|$')
plt.axis([-1,101,0.5e-5,2]);

ax2=fig.add_subplot(gs[1,0])
fac2=0.15
ex=corr*(18.5650511599/(2*10)-10/(2*np.sqrt(27.0/2)))
ax2.plot(range(n),energies[idx],color=qual_cp4[1])
yl2=plt.ylabel(r'$E_n$')
deltaE=abs(min(np.array(energies[idx]))-max(np.array(energies[idx])))
Emin=min(np.array(energies[idx]))-fac2*deltaE
Emax=max(np.array(energies[idx]))+fac2*deltaE
plt.axis([-1,n,Emin,Emax]);
plt.yticks(np.arange(Emin, Emax, abs(Emax-Emin)/4.0))
ax2.plot([0,n+1],[ex,ex],ls=':',color='r',lw=1)

ax3 = ax2.twinx()
fac3=0.4
ax3.plot([0],overlaps[idx][0],color=qual_cp4[1],label=r'$E_n$')
ax3.plot(range(n),overlaps[idx],ls="--",color=qual_cp4[3],label=r'$f$')
ax3.plot([0],overlaps[idx][0],ls=':',color='r',lw=1,label=r'$E_L$')
yl3=plt.ylabel(r'$f_n$')
deltaov=abs(min(overlaps[idx])-max(overlaps[idx]))
ovmin=min(overlaps[idx])-fac3*deltaov
ovmax=max(overlaps[idx])+fac3*deltaov
plt.axis([-1,n,ovmin,ovmax]);
ax3.plot([0,n+1],[1,1],ls='-',color='k',lw=1)

ax2.axes.get_xaxis().set_ticklabels([])
ax3.axes.get_xaxis().set_ticklabels([])
plt.legend(loc='lower right',ncol=3)

ax4=fig.add_subplot(gs[2,0])
ex=corr*(18.5650511599/(2*10)-10/(2*np.sqrt(27.0/2)))
ax4.plot(range(n),np.absolute(energies[idx]-ex),color=qual_cp4[1],label=r'$E$')
yl2=plt.ylabel(r'$|E_n-E_L|$')
xl=plt.xlabel(r'$n$')
deltaE=abs(min(np.absolute(np.array(energies[idx])-ex))-max(np.absolute(np.array(energies[idx])-ex)))
Emin=min(np.absolute(np.array(energies[idx])-ex))-fac*deltaE
Emax=max(np.absolute(np.array(energies[idx])-ex))+fac*deltaE
#plt.yticks(np.arange(Emin, Emax, abs(Emax-Emin)/4.0))
plt.yscale('log', nonposy="clip")

currov=np.abs(np.array(overlaps[idx])-1.0)

ax5 = ax4.twinx()
ax5.plot([0],currov[0],color=qual_cp4[1],label=r'$E$')
ax5.plot(range(n),currov,ls="--",color=qual_cp4[3],label=r'$f$')
yl5=plt.ylabel(r'$|f_n-1|$')
deltaov=abs(min(currov)-max(currov))
ovmin=min(currov)-fac*deltaov
ovmax=max(currov)+fac*deltaov

plt.yscale('log', nonposy="clip")
plt.legend(loc='upper right')

gs.update(wspace=0.5, hspace=0.3)

plt.savefig('Sphere_plots/LaughlinVsd0_Overlap_Energy_f_N_10_3pane.pdf', bbox_extra_artists=(yl3,), bbox_inches='tight')
How can I get those ticks? I would definitely want them on the x-axes; not sure on the y-axes (will have a look first)
EDIT: Here is an executable test code with the same problem:
import csv
import numpy as np
import matplotlib.pyplot as plt
from matplotlib import gridspec
from matplotlib import ticker
import pandas as pd
import seaborn as sns
sns.set_style('white')
from sys import path

fig = plt.figure()
gs = gridspec.GridSpec(3, 1)
N=10.0
Nphi=27.0
corr=np.sqrt(Nphi/(3*N))
idx=0
n=100
fac=0.2

ax1=fig.add_subplot(gs[0,0])
#plt.title("Regular Laughlin   "+r'$\nu=1/3$'+"   "+r'$N_e=10$')
overlaps=np.random.rand(n)
errors=0.1*np.random.rand(n)
ax1.errorbar(range(n),overlaps,errors,ms=4,mew=0.7,marker="o",ls='none',elinewidth=0.7,capsize=3,fillstyle='none',color='r',label="d=0")
ax1.axes.get_xaxis().set_ticklabels([])

plt.yscale('log', nonposy="clip")
plt.axis([-2,101,1e-5,1.2])
plt.legend(loc='lower right')
yl1=plt.ylabel(r'$|\langle\psi_L^d|\phi_n\rangle|$')
plt.axis([-1,101,0.5e-5,2]);

ax2=fig.add_subplot(gs[1,0])
fac2=0.15
ex=corr*(18.5650511599/(2*10)-10/(2*np.sqrt(27.0/2)))
energies=ex*np.random.rand(n)
ax2.plot(range(n),energies,color='b',lw=1)
yl2=plt.ylabel(r'$E_n$')
deltaE=abs(min(np.array(energies))-max(np.array(energies)))
Emin=min(np.array(energies))-fac2*deltaE
Emax=max(np.array(energies))+fac2*deltaE
plt.axis([-1,n,Emin,Emax]);
plt.yticks(np.arange(Emin, Emax, abs(Emax-Emin)/4.0))
ax2.plot([0,n+1],[ex,ex],ls=':',color='r',lw=1)

plt.savefig('testfig.pdf', bbox_inches='tight')


y_formatterdo inplt.gca().yaxis.set_major_formatter(y_formatter)? I would think that there are tick marks by default, but you turn them off. And anything fishy in yourrcParams? – Peasecod