Plotly Scattermapbox, unable to add text to markers
Asked Answered
E

4

3

I am trying to add text to the plotly map below, original code modified from https://plotly.com/python/lines-on-mapbox/

import plotly.graph_objects as go

fig = go.Figure(go.Scattermapbox(
    mode = "markers",

    marker = {'size': 10}))

fig.add_trace(go.Scattermapbox(
    mode = "markers",
    lon = longlist,
    lat = latlist,
    marker = {'size': 10}))


fig.update_layout(
    margin ={'l':0,'t':0,'b':0,'r':0},
    mapbox = {
        
        'style': "stamen-terrain",
        'center': {'lon': -20, 'lat': -20},
        'zoom': 1})

fig.show()
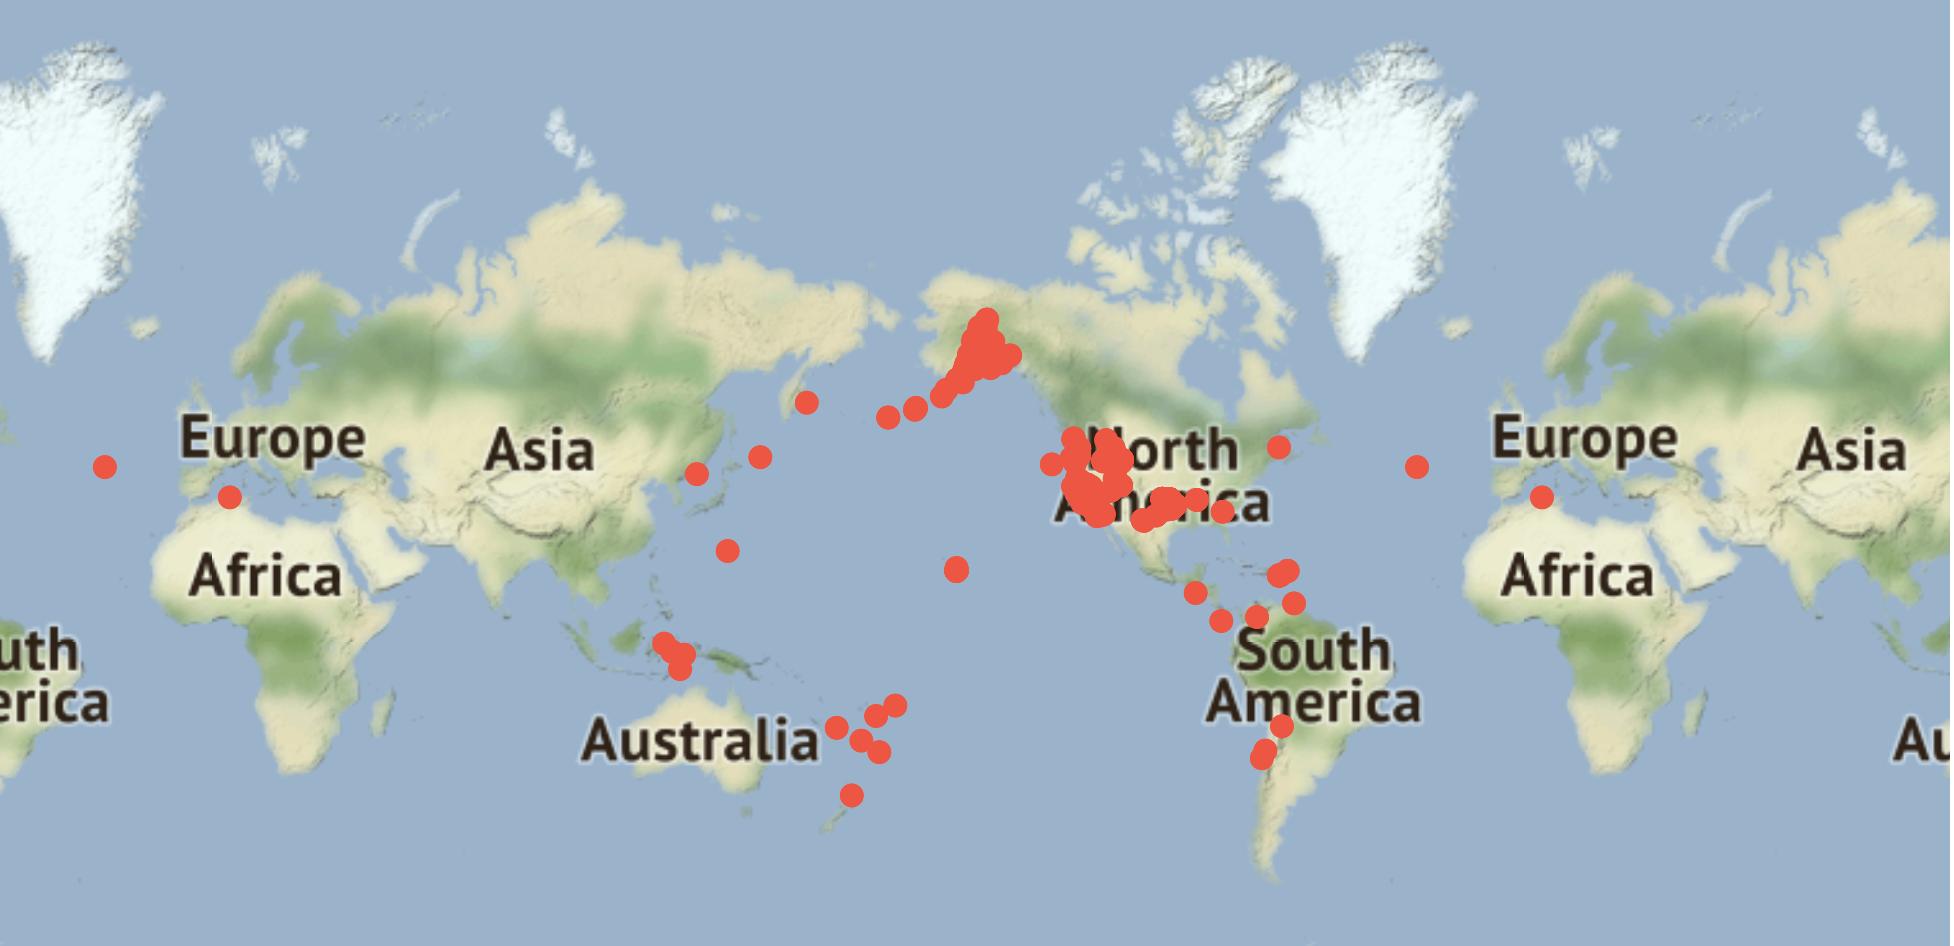
enter image description here I have tried to copy the solution provided at Plotly Scattermapbox: Is there a way to include some text above and below the markers?

See my edited code below which includes new text code to retrieve data from magnitudelist and new code for mapbox_access_token

import plotly.graph_objects as go

mapbox_access_token = 'mytoken'


fig = go.Figure(go.Scattermapbox(
    mode = "markers",

    marker = {'size': 10}))

data = fig.add_trace(go.Scattermapbox(
    mode = "markers",
    lon = longlist,
    lat = latlist,
    marker = {'size': 10},
    textposition='top right',
    textfont=dict(size=16, color='black'),
    text = magnitudelist
))


layout = dict(margin=dict(l=0, t=0, r=0, b=0, pad=0),
              mapbox=dict(accesstoken=mapbox_access_token,
                          center=dict(lat=-20, lon=-20),
                          style='stamen-terrain',
                          zoom=1))


fig = go.Figure(data=data, layout=layout)
fig.show()

Result blank enter image description here

I am trying to get a result more like this

enter image description here

Any suggestions would be appreciated
Extravagate answered 28/3, 2021 at 22:8 Comment(0)
G
3

I found that the text only works with the vector backgrounds served from mapbox. Raster backgrounds result in some javascript errors.

See https://plotly.com/javascript/mapbox-layers/#mapbox-access-tokens-and-when-you-need-them, styles listed under item 3 in section 'Base Maps ...' are the ones that work.

Glutinous answered 14/1, 2022 at 13:38 Comment(0)
M
2

2 main elements seem to be the source of your problem (thanks for previous answers' help):

  1. The scattermapbox "mode" argument needs to include a text element (ex. 'markers+text')

  2. You have to use a vector basemap ["basic", "streets", "outdoors", "light", "dark", "satellite","satellite-streets"] (free mapbox access token needed) in order to be able to show text values on the map (thanks to micce answer). Note that All scattermapbox on a same app or dashboard have to use a vector basemap even if only one of them needs to show text values

Also one precision: If using a pandas Series to feed Scattermapbox "text" argument, make sure to convert that Series into a list (ex: df['name'].tolist()) which is strangely not necessary for the "lat" and "lon" arguments

here's a code example:

lat=new_df['lat']
lon= new_df['lon']
values=new_df['2019']
mapbox_access_token="copy your mapbox access token"
fig2=go.Figure(go.Scattermapbox(
    lat=lat,
    lon=lon,
    mode='markers+text',
    marker=go.scattermapbox.Marker(
        size=17,
        color='rgb(5, 50, 220)',
        opacity=0.6
    ),
    text=values.tolist(),
    hoverinfo='text', hovertext=zones, textposition = "top left", 
 textfont=dict(color='black', size=18)))
 fig2.update_layout(autosize=True, showlegend=False, mapbox=dict(
    accesstoken=mapbox_access_token,
    bearing=0,
    pitch=30,
    zoom=5,
    style='light', 
    center=dict(lat=lat[0], lon=lon[0])
), margin={"r": 0, "t": 0, "l": 0, "b": 0})

rendering

Mayhap answered 2/6, 2022 at 14:57 Comment(0)
C
0

I had the same problem, try the following:

  1. Include "text" in the Scattermapbox mode and specify a string or array of strings to show:
fig.add_trace(go.Scattermapbox(
      mode = "markers+text", # include text mode
      lon = longlist,
      lat = latlist,
      marker = {'size': 10},
      text = textlist)) # include text list
  1. Try another mapbox style, like "light":
layout = dict(margin=dict(l=0, t=0, r=0, b=0, pad=0),
              mapbox=dict(accesstoken=mapbox_access_token,
                          center=dict(lat=-20, lon=-20),
                          style='light', # change mapbox style
                          zoom=1))
Coil answered 23/4, 2021 at 16:52 Comment(1)
Thank you for the suggestion. I haven't got it to work yet trying this, but it looks like a good idea.Extravagate
T
0

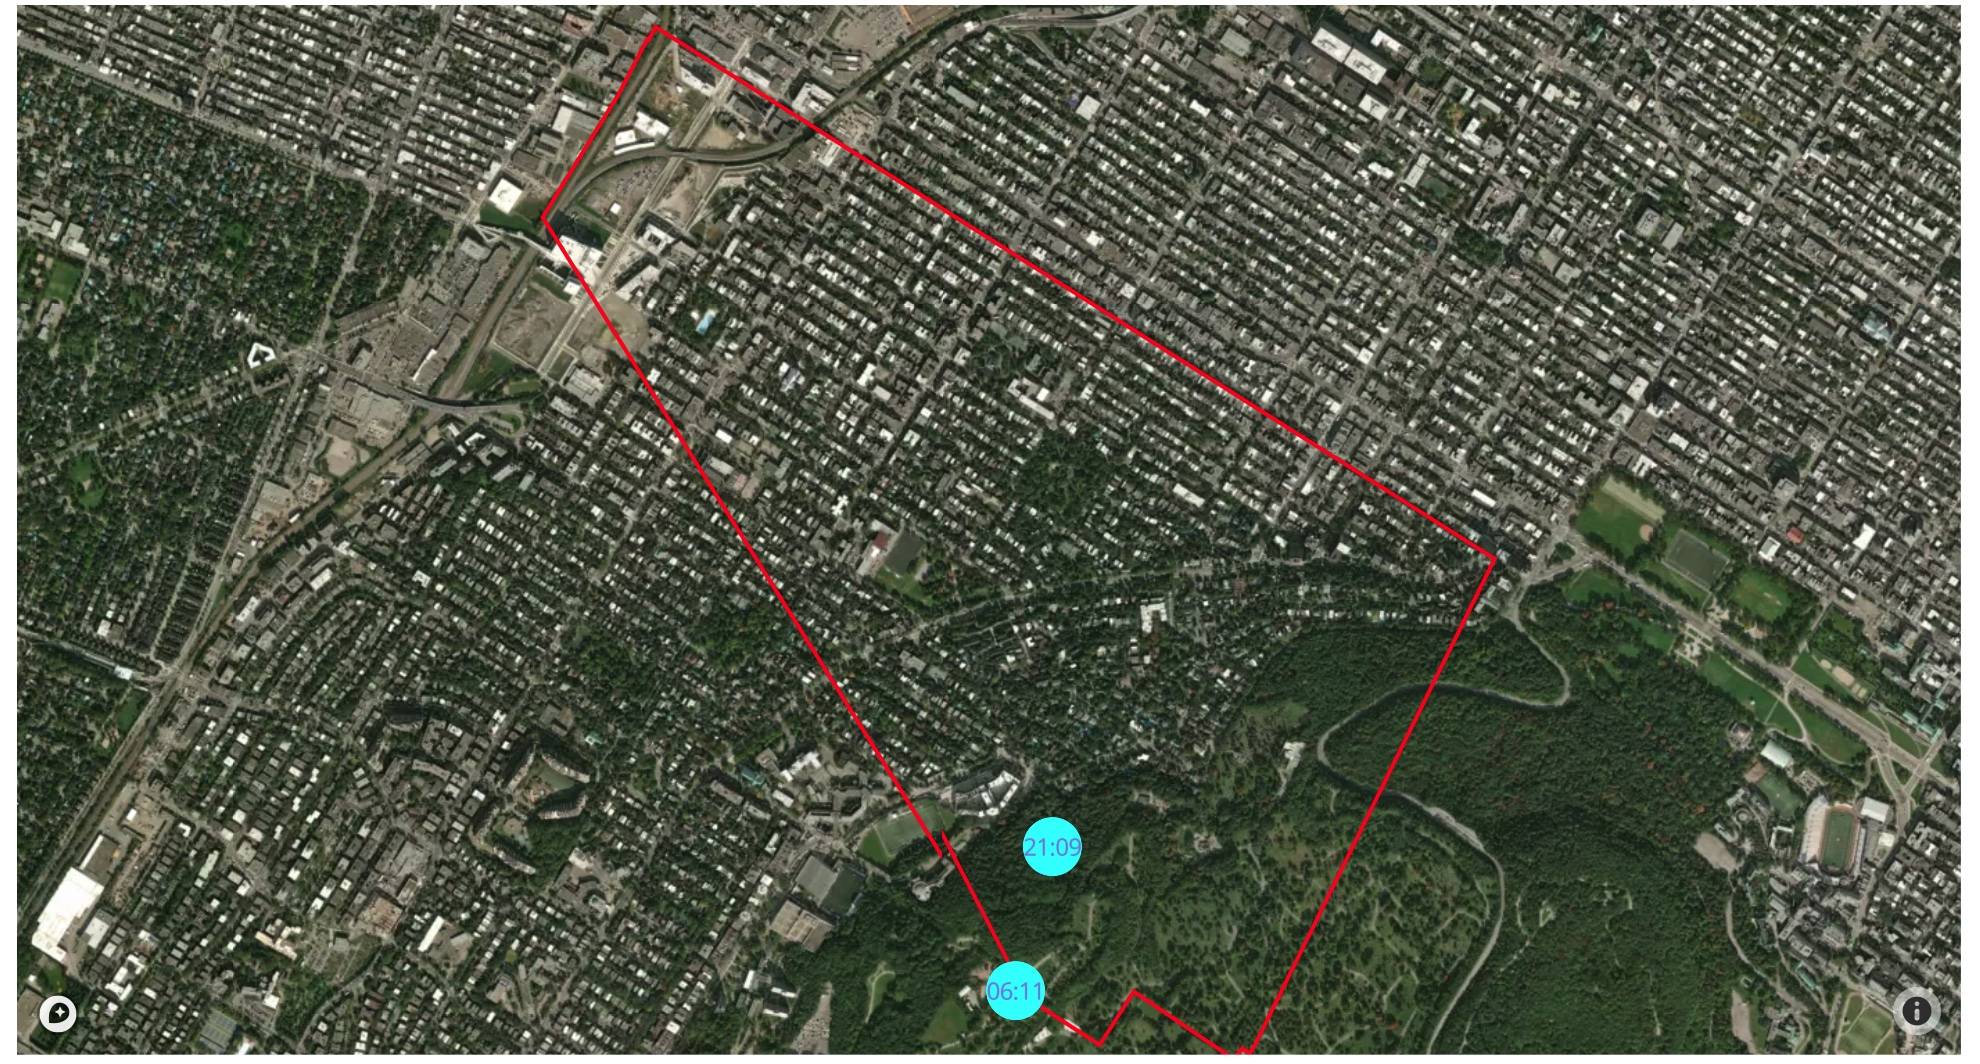
Here is a working example drawing text inside markers on a satellite map

import plotly.graph_objects as go

# create our figure blank which we will build onto. the biggest thing i saw
# was that you have to specify the mode that will show markers as well as text

fig = go.Figure(
      go.Scattermapbox(
      mode = "lines+markers+text",
    )
)


# Make sure to use your access token and draw the polygon/lines/features you want

fig.update_layout(
    mapbox = {
        'style': "satellite",
        'accesstoken': "pk.your_access_token",
        'center': { 'lon': -73.605, 'lat': 45.51},
        'zoom': 15,       
        'layers': [{
            'source': {
                'type': "FeatureCollection",
                'features': [
                    {
                    
                        'type': "Feature",
                        'geometry': {
                        'type': "MultiPolygon",
                        'coordinates': [[[
                            [-73.606352888, 45.507489991], [-73.606133883, 45.50687600],
                            [-73.605905904, 45.506773980], [-73.603533905, 45.505698946],
                            [-73.602475870, 45.506856969], [-73.600031904, 45.505696003],
                            [-73.599379992, 45.505389066], [-73.599119902, 45.505632008],
                            [-73.598896977, 45.505514039], [-73.598783894, 45.505617001],
                            [-73.591308727, 45.516246185], [-73.591380782, 45.516280145],
                            [-73.596778656, 45.518690062], [-73.602796770, 45.521348046],
                            [-73.612239983, 45.525564037], [-73.612422919, 45.525642061],
                            [-73.617229085, 45.527751983], [-73.617279234, 45.527774160],
                            [-73.617304713, 45.527741334], [-73.617492052, 45.527498362],
                            [-73.617533258, 45.527512253], [-73.618074188, 45.526759105],
                            [-73.618271651, 45.526500673], [-73.618446320, 45.526287943],
                            [-73.618968507, 45.525698560], [-73.619388002, 45.525216750],
                            [-73.619532966, 45.525064183], [-73.619686662, 45.524889290],
                            [-73.619787038, 45.524770086], [-73.619925742, 45.524584939],
                            [-73.619954486, 45.524557690], [-73.620122362, 45.524377961],
                            [-73.620201713, 45.524298907], [-73.620775593, 45.523650879]
                        ]]]
                    }
                }]
            },
            'type': "line", 'below': "traces", 'color': "red"}]},
    margin = {'l':0, 'r':0, 'b':0, 't':0}
)


# finally add a trace of the markers you want as a list

fig.add_trace( go.Scattermapbox(
    lat=[45.51, 45.50687600],
    lon=[-73.605, -73.606133883,],
    marker={
        "color": "cyan",
        "size": 30,

    },
    mode="markers+text",
    text=["21:09", "06:11", ],
    textfont = {'family': "Times", 'size': 12, 'color': "MediumPurple"},
    
    textposition="middle center"
))


The end result looks like this:

enter image description here

Taxeme answered 6/12, 2021 at 12:47 Comment(0)

© 2022 - 2024 — McMap. All rights reserved.