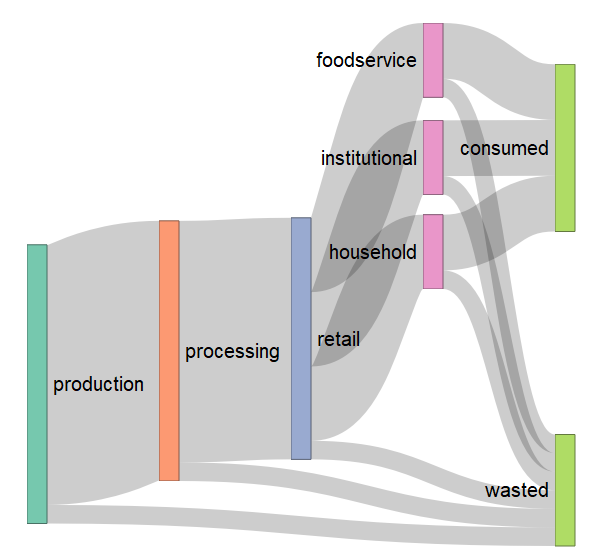
I would like to use the ggforce package in R to create a Sankey diagram because I prefer the look of the parallel sets plots made with ggforce to other visualizations. I have nodes that are sorted into levels from left to right. However I want some of the links to go directly from, say, level 1 to level 5 without touching nodes in between. This image shows a Sankey diagram made with networkd3 where "production" links directly to "wasted" across intervening levels. 
Is this type of diagram possible to create with ggforce? I have tried the following but it returns an error because it does not allow missing values for any of the levels.
Input data
fsc_sankey <- structure(list(stage1 = c("production", "production", "production",
                                        "production", "production", "production", "production", "production",
                                        "production"), stage2 = c(NA, "processing", "processing", "processing",
                                                                  "processing", "processing", "processing", "processing", "processing"
                                        ), stage3 = c(NA, NA, "retail", NA, NA, NA, NA, "retail", "retail"
                                        ), stage4 = c(NA, NA, NA, "foodservice", "foodservice", "institutions",
                                                      "institutions", "households", "households"), destination = c("waste",
                                                                                                                   "waste", "waste", "consumed", "waste", "consumed", "waste", "consumed",
                                                                                                                   "waste"), value = c(1L, 1L, 1L, 3L, 1L, 3L, 1L, 3L, 1L)), class = "data.frame", row.names = c(NA,
                                                                                                                                                                                                                 -9L))
Code
library(tidyverse)
library(ggforce)

fsc_sankey_set <- gather_set_data(fsc_sankey, 1:5) %>%
  mutate(x = factor(x, levels = c('stage1','stage2','stage3','stage4','destination')))

ggplot(fsc_sankey_set, aes(x, id = id, split = y, value = value)) +
  geom_parallel_sets(alpha = 0.3, axis.width = 0.1) +
  geom_parallel_sets_axes(axis.width = 0.1) +
  geom_parallel_sets_labels(colour = 'white')
