There are two errors in your code that prevents you from getting the desired results.
The first error is that you should put the distance calculation in the loop. Because the distance is the loss in this case. So we have to monitor its change in each iteration.
The second error is that you should manually zero out the x.grad because pytorch won't zero out the grad in variable by default.
The following is an example code which works as expected:
import torch
import numpy as np
from torch.autograd import Variable
import matplotlib.pyplot as plt

# regress a vector to the goal vector [1,2,3,4,5]

dtype = torch.cuda.FloatTensor # Uncomment this to run on GPU

x = Variable(torch.rand(5).type(dtype), requires_grad=True)
target = Variable(torch.FloatTensor([1,2,3,4,5]).type(dtype),
requires_grad=False)

lr = 0.01 # the learning rate

d = []
for i in range(1000):
  distance = torch.mean(torch.pow((x - target), 2))
  d.append(distance.data)
  distance.backward(retain_graph=True)

  x.data.sub_(lr * x.grad.data)
  x.grad.data.zero_()

print(x.data)

fig, ax = plt.subplots()
ax.plot(d)
ax.set_xlabel("iteration")
ax.set_ylabel("distance")
plt.show()
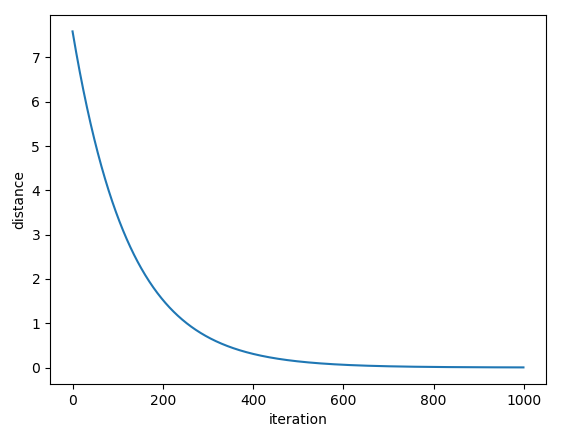
The following is the graph of distance w.r.t iteration
![enter image description here]()
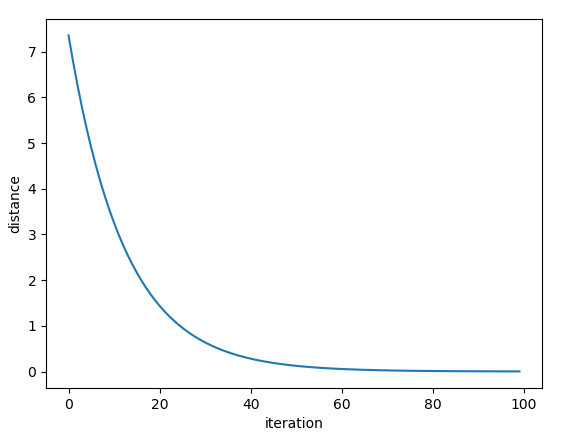
We can see that the model converges at about 600 iterations. If we set the learning rate to be higher (e.g, lr=0.1), the model will converge much faster (it takes about 60 iterations, see image below)
![enter image description here]()
Now, x becomes something like the following
0.9878
1.9749
2.9624
3.9429
4.9292
which is pretty close to your target of [1, 2, 3, 4, 5].


