How to plot several variables on an axis with Vega-Lite?
Asked Answered
L

1

2

Following Vega-Lite's Seattle weather tutorial, it was easy to plot avg min temperature by month:

{
  "$schema": "https://vega.github.io/schema/vega-lite/v2.json",
  "data": {
    "url": "https://vega.github.io/vega-lite/data/seattle-weather.csv"
  },
  "mark": "line",
  "encoding": {
    "x": {
      "timeUnit": "month",
      "field": "date",
      "type": "temporal"
    },
    "y": {
      "aggregate": "mean",
      "field": "temp_min",
      "type": "quantitative"
    }
  }
}

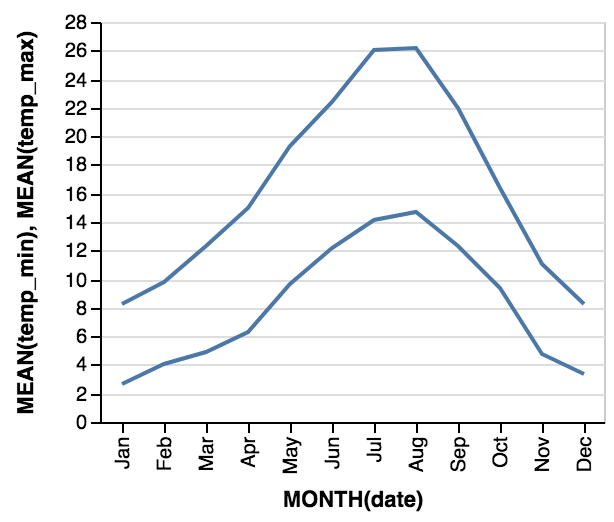
This dataset also has temp_max variable. How can I plot both temp_min and temp_max on y-axis?

Labrie answered 18/7, 2017 at 7:15 Comment(0)
A
6

You can use layering as described at https://vega.github.io/vega-lite/docs/layer.html.

{
  "data": {"url": "data/seattle-weather.csv"},
  "layer": [
    {
      "mark": "line",
      "encoding": {
        "x": {
          "timeUnit": "month",
          "field": "date",
          "type": "temporal"
        },
        "y": {
          "aggregate": "mean",
          "field": "temp_min",
          "type": "quantitative"
        }
      }
    },
    {
      "mark": "line",
      "encoding": {
        "x": {
          "timeUnit": "month",
          "field": "date",
          "type": "temporal"
        },
        "y": {
          "aggregate": "mean",
          "field": "temp_max",
          "type": "quantitative"
        }
      }
    }
  ]
}

layered chart

Aegyptus answered 31/7, 2017 at 5:6 Comment(0)

© 2022 - 2024 — McMap. All rights reserved.