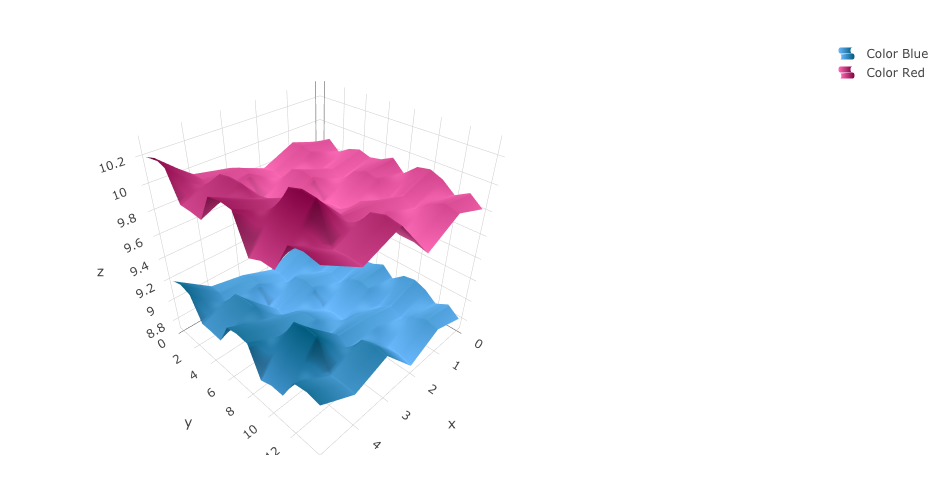
Take the example for plot_ly function:
library("plotly")
z <- c(
  c(8.83,8.89,8.81,8.87,8.9,8.87),
  c(8.89,8.94,8.85,8.94,8.96,8.92),
  c(8.84,8.9,8.82,8.92,8.93,8.91),
  c(8.79,8.85,8.79,8.9,8.94,8.92),
  c(8.79,8.88,8.81,8.9,8.95,8.92),
  c(8.8,8.82,8.78,8.91,8.94,8.92),
  c(8.75,8.78,8.77,8.91,8.95,8.92),
  c(8.8,8.8,8.77,8.91,8.95,8.94),
  c(8.74,8.81,8.76,8.93,8.98,8.99),
  c(8.89,8.99,8.92,9.1,9.13,9.11),
  c(8.97,8.97,8.91,9.09,9.11,9.11),
  c(9.04,9.08,9.05,9.25,9.28,9.27),
  c(9,9.01,9,9.2,9.23,9.2),
  c(8.99,8.99,8.98,9.18,9.2,9.19),
  c(8.93,8.97,8.97,9.18,9.2,9.18)
)
dim(z) <- c(15,6)
z2 <- z + 1

fig <- plot_ly(showscale = FALSE)
fig <- fig %>% add_surface(z = ~z, colorscale = list(c(0,1),c("rgb(107,184,255)","rgb(0,90,124)")))
fig <- fig %>% add_surface(z = ~z2, colorscale = list(c(0,1),c("rgb(255,107,184)","rgb(128,0,64)")))
How can I add legends to this 3d plot?


showscale = TRUEinstead there are two legends. Is that what you want. Otherwise, can you be more specific? – Crineaand yellow isbfor instance. @Crine – Mcdonald