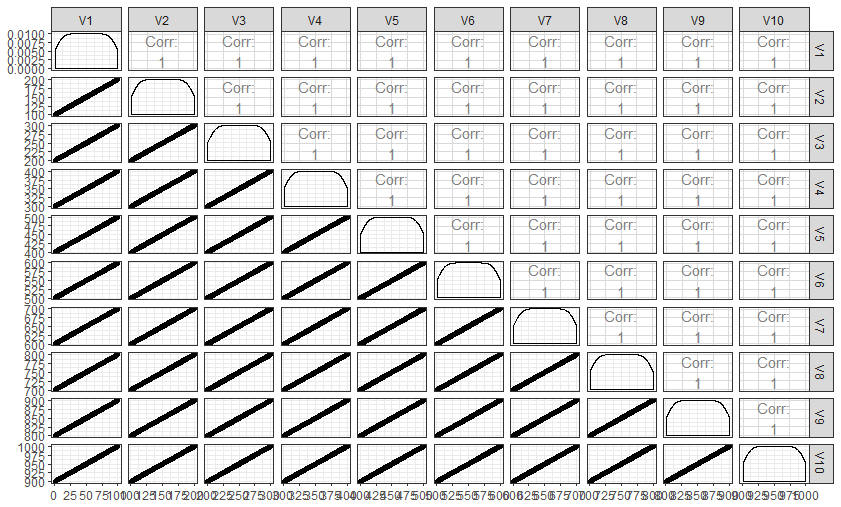
I want to show just the minimum and maximum values for all the axes of a ggpairs {GGally} plot. Find below a reproducible example
df=as.data.frame(matrix(1:1000,nrow = 100))
ggpairs(df)
I know I can do it individually by using breaks, but I don't know how can I apply this in ggpairs. Can somebody help me?


my_fn <- function(data, mapping, ...){ ggplot(data = data, mapping = mapping, ...) + ; geom_point(...) + ; scale_y_continuous(breaks=round(range(data[,as.character(mapping$y)]))) +; scale_x_continuous(breaks=round(range(data[,as.character(mapping$x)]))) }. Then plotggpairs(df, lower=list(continuous=my_fn)). You can tweak the breaks to make more pretty values, change the density plot similarilty etc etc – Microprint