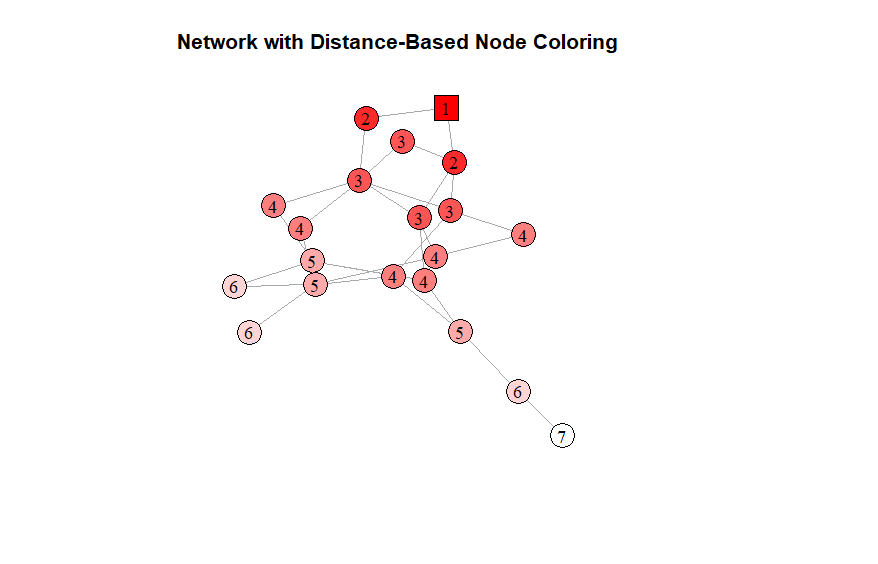
I have a random graph in R in which one random node is colored red (square) - and all other nodes are colored lighter shades of red relative to their distance from the original node (i.e. based on "degree"):
 library(igraph)
library(colorRamps)

set.seed(123)

n_nodes <- 20
n_edges <- 30
g <- erdos.renyi.game(n_nodes, n_edges, type = "gnm")

random_red_node <- sample(1:n_nodes, 1)

distances <- distances(g, v = random_red_node, to = V(g))
max_distance <- max(distances)

color_palette <- colorRampPalette(c("red", "white"))(max_distance + 1)

node_colors <- color_palette[distances + 1]
node_colors[random_red_node] <- "red"

node_shapes <- rep("circle", n_nodes)
node_shapes[random_red_node] <- "square"

node_labels <- distances + 1

par(mar = c(5, 4, 4, 8), xpd = TRUE)

plot(g,
     vertex.color = node_colors,
     vertex.size = 15,
     vertex.label = node_labels,
     vertex.label.color = "black",
     vertex.shape = node_shapes,
     vertex.frame.color = "black",
     edge.arrow.size = 0.5,
     main = "Network with Distance-Based Node Coloring")
I am trying to change this so that now I can have multiple square nodes of different colors, and the same fading is applied:
The idea is to mimic diffusion of colors such that they create natural boundaries.
Thank you.
Here is a question that might help: How to tell if a point has been colored twice in R?
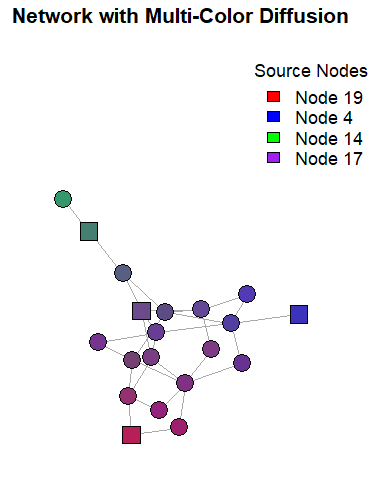
edit: My approach - this only works for a few nodes and will not work for multiple source nodes of the same color (e.g. multiple reds)
First, I use a function to define the color gradients:
library(igraph)
library(colorRamps)

set.seed(123)

blend_colors <- function(colors, weights) {
    if (length(colors) != length(weights)) stop("")

    rgb_colors <- col2rgb(colors)
    blended <- rowSums(rgb_colors %*% diag(weights)) / sum(weights)
    rgb(blended[1], blended[2], blended[3], maxColorValue = 255)
}
I then generate a network for the problem:
n_nodes <- 20
n_edges <- 30
g <- erdos.renyi.game(n_nodes, n_edges, type = "gnm")

n_colored_nodes <- 4
colored_nodes <- sample(1:n_nodes, n_colored_nodes)
node_colors <- c("red", "blue", "green", "purple")[1:n_colored_nodes]
The fading is a function of distance, I tried to capture this idea:
distances_list <- lapply(colored_nodes, function(node) {
  distances(g, v = node, to = V(g))
})
max_distance <- max(unlist(distances_list))
normalized_distances <- lapply(distances_list, function(d) {
  1 - (d / max_distance)
})
Here is how I call this :
blended_colors <- sapply(1:n_nodes, function(i) {
  weights <- sapply(normalized_distances, function(d) d[i])
  blend_colors(node_colors, weights)
})

node_shapes <- rep("circle", n_nodes)
node_shapes[colored_nodes] <- "square"

par(mar = c(5, 4, 4, 8), xpd = TRUE)

plot(g,
     vertex.color = blended_colors,
     vertex.size = 15,
     vertex.label = NA,
     vertex.shape = node_shapes,
     vertex.frame.color = "black",
     edge.arrow.size = 0.5,
     main = "Network with Multi-Color Diffusion")

legend("topright", inset = c(-0.2, 0),
       legend = paste("Node", colored_nodes),
       fill = node_colors,
       title = "Source Nodes",
       bty = "n")


