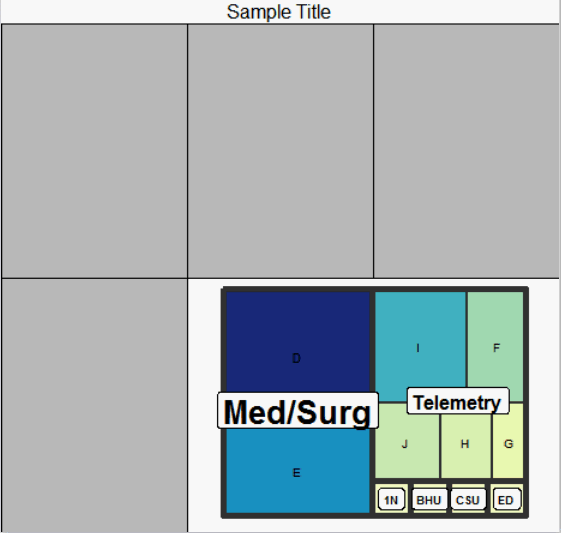
The good news: I'm able to create a beautiful treemap using the treemap package.
Data:
forTm <- structure(list(
  UnitGroup = c("1N", "BHU", "CSU", "ED", "Med/Surg", "Med/Surg", "Telemetry",
            "Telemetry", "Telemetry", "Telemetry", "Telemetry"),
  Unit = c("A", "B", "C", "ED", "D", "E", "F", "G", "H", "I", "J"),
  Count = c(1L, 1L, 1L, 1L, 15L, 10L, 5L, 2L, 3L, 8L, 4L)),
  class = c("data.frame"),
  row.names = c(NA, -11L),
  .Names = c("UnitGroup", "Unit", "Count"))
Treemap:
library(treemap)
tm <- treemap(forTm,
          index = c("UnitGroup", "Unit"),
          vSize = "Count",
          vColor = "Count",
          type = "dens",
          palette = "YlGnBu",
          title = "# Patients Sample Title",
          aspRatio = (1.5),
          fontsize.labels = c(16, 12),
          fontsize.title = 16,
          bg.labels = "white",
          border.lwds = c(5,0))
The problem: class(tm) is a list, and I need to plot the treemap on a page with several ggplots. I anticipate needing to add/rearrange the plots for the end user, so I'd like a relatively flexible solution.
Goal: insert treemap into the following dashboard:
#just stand-ins for the plots
samplePlot <- grid.rect(gp = gpar(fill = "grey"))
treemapHere <- grid.rect(gp = gpar(fill = "blue"))

grid.arrange(samplePlot, # plot 1
         treemapHere, # plot 2
         samplePlot, # plot 3
         layout_matrix = rbind(c(3, 2), c(1, 1)),
         top = textGrob("Sample Title",
                        gp = gpar(margin = margin(10, 0, 10, 0))),
         heights = c(5, 5))
But the solution needs to be flexible enough that I can easily add/rearrange the plots, for example as follows:
grid.arrange(samplePlot, # plot 1
         samplePlot, # plot 2
         samplePlot, # plot 3
         samplePlot, # plot 4
         treemapHere, # plot5
         layout_matrix = rbind(c(1, 2, 3),
                               c(4, 5, 5)),
         top = textGrob("Sample Title",
                        gp = gpar(margin = margin(10, 0, 10, 0))),
         heights = c(5, 5))
Ideally I'd find a way to recreate the treemap as a ggplot, because I'm very familiar with ggplot's syntax so I'd have an easy time standardizing the sheet's style. But if there's no way to do that I'll accept any solution(save the treemap as a grob?) that allows me to easily rearrange this graph within my page of ggplots.
What I've tried so far: Honestly, not much. Google hasn't been my friend. The only recommendation I've found is to use treemapify, which I can't do for this particular project.


treemapseems to be plotted withgridgraphics and it allows you to specify a viewport to draw into (viavp=). What kind of layout with other ggplots are you trying to achieve? How are you arranging the other ggplots? – Adiposecolor <- grid.rect(gp = gpar(col = "grey")) grid.arrange(color, # plot 1 color, # treemap here color, # plot 3 layout_matrix = rbind(c(2, 3), c(1, 1)), top = textGrob("Sample Title", gp = gpar(fontsize = 16, font = 2, margin = margin(10, 0, 10, 0))), heights = c(5, 5))– Brantleytmsince that really isn't helpful. Thetreemapfunction draw the plot as a side effect directly. It's doesn't have a separateplot()orprint()method like ggplot objects do. It's hard to say what will work without some testing. – Adiposeggraph(link) which is an extension ofggplot2that aims at supporting relational data structures such as networks, graphs, and trees etc. It also supports Treemaps. – Inappetence