Spatial nearest neighbor assignment in R
Asked Answered
F

2

5

I am working on a study that is trying to assign particulate matter exposure to specific individuals based on their addresses. I have two data sets with longitude and latitude coordinates. One if for individuals and one if for pm exposure blocks. I want to assign each subject with a pm exposure block based on the block that is closest.

library(sp)
library(raster)
library(tidyverse)

#subject level data
subjectID<-c("A1","A2","A3","A4")

subjects<-data.frame(tribble(
~lon,~lat,
-70.9821391,    42.3769511,
-61.8668537,    45.5267133,
-70.9344039,    41.6220337,
-70.7283830,    41.7123494
))

row.names(subjects)<-subjectID

#PM Block Locations 
blockID<-c("B1","B2","B3","B4","B5")

blocks<-data.frame(tribble(
~lon,~lat,
-70.9824591,    42.3769451,
-61.8664537,    45.5267453,
-70.9344539,    41.6220457,
-70.7284530,    41.7123454,
-70.7284430,    41.7193454
))

row.names(blocks)<-blockID

#Creating distance matrix
dis_matrix<-pointDistance(blocks,subjects,lonlat = TRUE)

###The above code doesnt preserve the row names. Is there a way to to do 
that?

###I'm unsure about the below code
colnames(dis_matrix)<-row.names(subjects)
row.names(dis_matrix)<-row.names(blocks)

dis_data<-data.frame(dis_matrix)

###Finding nearst neighbor and coercing to usable format 
getname <-function(x) {
row.names(dis_data[which.min(x),])
}

nn<-data.frame(lapply(dis_data,getname)) %>% 
gather(key=subject,value=neighbor)

This code gives me output that makes sense but I'm unsure of the validity and efficiency. Any suggestion on how to improve and fix this code are appreciated. I also receive the error message:

Warning message:
attributes are not identical across measure variables;
they will be dropped 

Which I can't determine the origin of.

Thanks for taking a look!

Frederiksen answered 5/12, 2017 at 21:51 Comment(0)
D
5

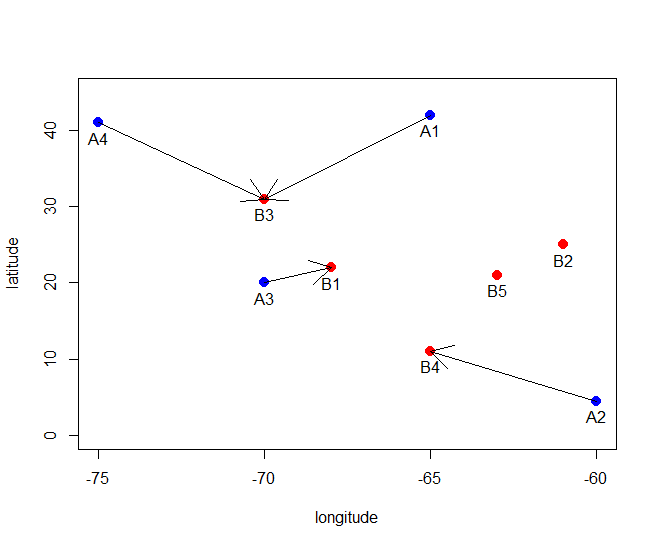
Here is, with some example data, how you can use pointDistance:

library(raster)

#subject level data
subjectID <- c("A1","A2","A3","A4")
subxy <- matrix(c(-65, 42, -60, 4.5, -70, 20, -75, 41 ), ncol=2, byrow=TRUE)
#PM Block Locations 
blockID <- c("B1","B2","B3","B4","B5")
blockxy <- matrix(c(-68, 22, -61, 25, -70, 31, -65, 11,-63, 21), ncol=2, byrow=TRUE)

# distance of all subxy to all blockxy points
d <- pointDistance(subxy, blockxy, lonlat=TRUE)

# get the blockxy record nearest to each subxy record
r <- apply(d, 1, which.min)
r
#[1] 3 4 1 3

So the pairs are:

p <- data.frame(subject=subjectID, block=blockID[r])
p

#  subject block
#1      A1    B3
#2      A2    B4
#3      A3    B1
#4      A4    B3

Illustrate that it works:

plot(rbind(blockxy, subxy), ylim=c(0,45), xlab='longitude', ylab='latitude')
points(blockxy, col="red", pch=20, cex=2)
points(subxy, col="blue", pch=20, cex=2)
text(subxy, subjectID, pos=1)
text(blockxy, blockID, pos=1)
for (i in 1:nrow(subxy)) {
    arrows(subxy[i,1], subxy[i,2], blockxy[r[i],1], blockxy[r[i],2])
}

arrows plot

Dall answered 5/12, 2017 at 23:54 Comment(2)
Thanks that is somewhat helpful. I think where I'm having trouble is going from the information contained in the "r" object to a dataset matching subjedtID with the closest block ID.Frederiksen
I have added that: data.frame(subject=subjectID, block=blockID[r])Dall
D
1

If you have a big dataset you might want to use the very efficient nabor package as explained by @user3507085 in this answer. Since the question is closed as off-topic I have copy-pasted the answer below, so it "stays alive" in this thread. I don't know if this is considered bad practice and I'm happy to delete/edit if requested (note the distances given by knn are not the geographical distances, but I guess they could be converted to spherical distances by a simple transformation including arcsin):

lonlat2xyz=function (lon, lat, r) 
{
lon = lon * pi/180
lat = lat * pi/180
if (missing(r)) 
    r <- 6378.1
x <- r * cos(lat) * cos(lon)
y <- r * cos(lat) * sin(lon)
z <- r * sin(lat)
return(cbind(x, y, z))
}

lon1=runif(100,-180,180);lon2=runif(100,-180,180);lat1=runif(100,-90,90);lat2=runif(100,-90,90)

xyz1=lonlat2xyz(lon1,lat1)
xyz2=lonlat2xyz(lon2,lat2)

library(nabor)

out=knn(data=xyz1,query = xyz2,k=20)

library(maps)

map()
points(lon1,lat1,pch=16,col="black")
points(lon2[1],lat2[1],pch=16,col="red")
points(lon1[out$nn.idx[1,]],lat1[out$nn.idx[1,]],pch=16,col="blue")
Demetra answered 7/12, 2017 at 8:23 Comment(2)
Thanks Ege, it's definitely helpful to consider efficiency here. The datasets are very large. I'll play with this version as well. Something to consider though it making sure you are using the correct ellipsoid (spherical model of the earth) in converting to geographical distanced. This is the advantage of the pointDistance function which uses the common WGS ellipsoid.Frederiksen
I would think that you can just use this approach with nabor to find the nearest neighbour of each of your points and then you can use another function (as pointDistance or geosphere::distGeo) to calculate the distance to the nearest neighbour exactly.Demetra

© 2022 - 2024 — McMap. All rights reserved.