Preliminary
To help establish this answer, I'm going to first make a generator for the data.
import numpy as np
from matplotlib import pyplot as plt

def make_r_theta_vals():
    thetas_radians = np.arange(0,2.01*np.pi,np.pi/100.)
    radii = np.arange(0,101,1)
    #meshgrid these to make a fuller array
    tr,rr = np.meshgrid(thetas_radians,radii)
    #generate fake z values
    z_vals = (75. * rr**(1./2.2)\
        + 50.*np.random.normal()*np.sin(tr) \
        + 20. * np.cos(tr) * np.sqrt(rr) \
        + np.cos(rr * np.pi / 100.) * np.sin(rr * np.pi/50.) * 6.)\
        * (np.sin(rr * np.pi/ 100.)**3. + 0.85)
    return thetas_radians, radii, z_vals
Here, z_vals is an NxM array, where N and M are the lengths of the r and theta values. In your question, this would correspond to rho, but I'd like to generalize this answer.
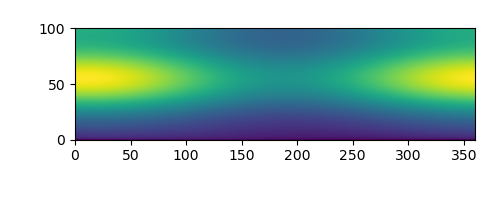
We can see that this produces a plot similar to your original plot,
def make_cartesian_plot():
    plt.clf()
    fig = plt.figure(figsize=[5,2])
    ax = fig.add_axes([0.15,0.18,0.8,0.8])
    thetas_radians, radii, z = make_r_theta_vals()
    ax.imshow(z,origin='lower',extent=[np.degrees(thetas_radians[0]),
                                        np.degrees(thetas_radians[-1]),
                                                   radii[0],radii[-1]])
    plt.savefig('cartesian.png')
with an output of
![a plot showing a changing radial pattern, plotted in cartesian coordinates]()
The Simple Way
To make this work in polar coordinates, we're going to use pcolormesh, along with the known r and theta values. If you don't have those, you will need to generate them similar to how I generated them in the first code snippet. Then, it's fairly easy:
def make_polar_plot():
    plt.clf()
    fig = plt.figure(figsize=[5,5])
    ax = fig.add_axes([0.1,0.1,0.8,0.8],polar=True)
    thetas_radians, radii, z = make_r_theta_vals()
    ax.pcolormesh(thetas_radians,radii,z,edgecolors='face')
    #ec='face' to avoid annoying gridding in pdf
    plt.savefig('polar.png')
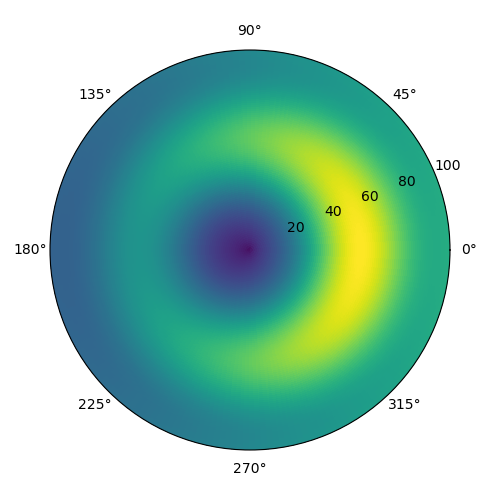
which produces:
![A polar plot showing a disk-like structure with a preference for a given angle]()
Decorative choices (such as removing the tick labels) are omitted for simplicity.
Polar on a Cartesian Grid
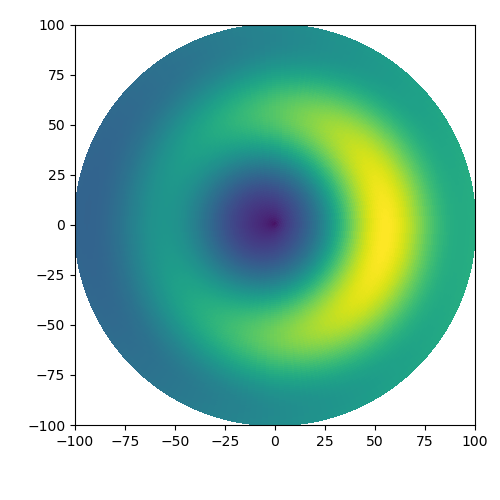
Conversely, the question as asked depicted a polar disk plotted onto rectangular grid. Assuming this is the desired output, we instead convert the r, theta, z to x,y,z. Here again, we used meshgrid to make a useful x and y and pcolormesh to handle the plotting.
def make_cartepolar_plot():
    plt.clf()
    fig = plt.figure(figsize=[5,5])
    ax = fig.add_axes([0.15,0.15,0.8,0.8])
    thetas_radians, radii, z = make_r_theta_vals()
    tr,rr = np.meshgrid(thetas_radians,radii)
    x_vals = rr * np.cos(tr)
    y_vals = rr * np.sin(tr)
    ax.pcolormesh(x_vals,y_vals,z,edgecolors='face')
    #ec='face' to avoid annoying gridding in pdf
    plt.savefig('carte_polar.png')
Here, the output is
![The polar plot shown above, now projected onto a Cartesian grid.]()
Note that, for a more complicated data set, you may need to see this previous question.

rho? pixel values? – Ascomycete