How to Retain the values in the Check Box in R Shiny App?
Asked Answered
T

3

5

I am trying to create a Shiny App. In this particular app i have a set of Radio buttons where choosing one will display a set of options below as Check Boxes and Choosing another radio button will choose other set of options. Kindly find the UI and the Server Code below.

library(shiny)
library(shinydashboard)
library(shinyWidgets)

d <-
  data.frame(
    year = c(1995, 1995, 1995, 1996, 1996, 1996, 1997, 1997, 1997),
    Product_Name = c(
      "Table",
      "Chair",
      "Bed",
      "Table",
      "Chair",
      "Bed",
      "Table",
      "Chair",
      "Bed"
    ),
    Product_desc = c("X", "X", "X", "Y", "Y", "Y", "Z", "Z", "Z"),
    Cost = c(1, 2, 3, 4, 2, 3, 4, 5, 6)
  )

ui <- shinyUI(fluidPage(
  useShinydashboard(),
  tabPanel(
    "Plot",
    sidebarLayout(
      sidebarPanel(
        radioButtons(
          "Choose",
          "Choose One",
          c("Year" = "p", "Numbers" = "l")
        ),
        uiOutput('checkbox'),
        #width = 2,
        position = "bottom"),
      mainPanel(uiOutput("graph"))

    )
  )
))

server <- function(input, output, session) {

  output$graph <- renderUI({
    # create tabPanel with datatable in it
    req(input$year)
    tabPanel("Plots",
             fluidRow(lapply(as.list(paste0("plot", seq_along(input$year))), plotOutput)))

  })

  output$checkbox <- renderUI({
    if (input$Choose == "p") {
      checkboxGroupInput("Cross",
                         "Year",
                         choices = (unique(d$year)))

    } else{
      checkboxGroupInput("Cross_1",
                         "Numbers",
                         choices = c("1","2","3"))
    }

  })

}

shinyApp(ui, server)

Now the challenge which I am facing is when i choose the "Year" Radio button the year values get displayed as check boxes and when i select the check boxes a corresponding graphs get displayed in the main panel (I have not given the code over here). Now when I choose the "Number" Radio Button the correct check box options are getting displayed. But when I move back to the "Year" Radio button. The already selected check box values are not retained so the user needs to check the boxes again to get the corresponding graphs.

The choices in CheckboxGroupInput() are dynamic in my case. So i will not be able to give this choices in UI(). Also i tried using updateCheckboxGroupInput() which failed. By doing some investigations in to the code once again, I understood that the place where the issue is taking place is this part of the code.

  output$checkbox <- renderUI({
    if (input$Choose == "p") {
      checkboxGroupInput("Cross",
                         "Year",
                         choices = (unique(d$year)))

    } else{
      checkboxGroupInput("Cross_1",
                         "Numbers",
                         choices = c("1","2","3"))
    }

  })

Please suggest me on how to retain the values in the checkbox even when the another radio button is chosen. Also please be informed that the options of Check boxes under each radio button will change according to the options the user has selected in the previous tab. So i use observe function to obtain the corresponding check boxes.

Tussore answered 23/4, 2020 at 8:45 Comment(0)
J
3

You could store the values of the years you attempt to keep in reactive values.

  global <- reactiveValues(years = NULL)

  observeEvent(input$Cross, {
    global$years <- input$Cross
  })

Then you make your dynamic ui dependent on the reactive values:

checkboxGroupInput(
  "Cross",
  "Year",
  choices = (unique(d$year)),
  selected = global$years
)

Reproducible example:

library(shiny)
library(shinydashboard)
library(shinyWidgets)

d <-
  data.frame(
    year = c(1995, 1995, 1995, 1996, 1996, 1996, 1997, 1997, 1997),
    Product_Name = c(
      "Table",
      "Chair",
      "Bed",
      "Table",
      "Chair",
      "Bed",
      "Table",
      "Chair",
      "Bed"
    ),
    Product_desc = c("X", "X", "X", "Y", "Y", "Y", "Z", "Z", "Z"),
    Cost = c(1, 2, 3, 4, 2, 3, 4, 5, 6)
  )

ui <- shinyUI(fluidPage(
  useShinydashboard(),
  tabPanel(
    "Plot",
    sidebarLayout(
      sidebarPanel(
        radioButtons(
          "Choose",
          "Choose One",
          c("Year" = "p", "Numbers" = "l")
        ),
        uiOutput('checkbox'),
        #width = 2,
        position = "bottom"),
      mainPanel(uiOutput("graph"))

    )
  )
))

server <- function(input, output, session) {

  global <- reactiveValues(years = NULL)

  observeEvent(input$Cross, {
    global$years <- input$Cross
  })

  output$graph <- renderUI({
    # create tabPanel with datatable in it
    req(input$year)
    tabPanel("Plots",
             fluidRow(lapply(as.list(paste0("plot", seq_along(input$year))), plotOutput)))

  })

  output$checkbox <- renderUI({
    if (input$Choose == "p") {
      checkboxGroupInput("Cross",
                         "Year",
                         choices = (unique(d$year)),selected = global$years)

    } else{
      checkboxGroupInput("Cross_1",
                         "Numbers",
                         choices = c("1","2","3"))
    }

  })

}

shinyApp(ui, server)

I think the shinyjs hide/show variant of Ash is also interesting. I havent tested it but i assume you could just replace the static ui with a dynamic there (?).

Joshua answered 16/6, 2020 at 3:6 Comment(3)
Thank you so much :) This actually works. Now I am able to retain the values in the Check box. Actually what I am trying to do is When the user selects a Check Box then a Plot will be plotted correspondingly in the main panel. Now when the user clicks on the Check boxes in Year radio button, the graph is getting plotted. But when the user is clicking on the Checkbox in the Numbers Radio button. The graphs are getting plotted. But they are getting plotted very below in the screen. In the main Panel should i use two UIOutput values ? for plotting these graphs in same level ?Tussore
Puh, it is not that easy to understand without seeing the actual code for that. Maybe you could share that in a new question and i am happy to take a look there!Joshua
Thanks for your help on this Tonio, I have posted the question here (stackoverflow.com/q/62441281/11104327)Tussore
M
2

I'd suggest showing/hiding the checkboxs rather than using renderUI. This way they will retain their settings even when they are not shown.

shinyjs is a popular package that can do this for us. I've created a minimal example based on the above code to show this in action:

library(shiny)
library(shinyjs)

ui <- shinyUI(fluidPage(

    useShinyjs(),

    radioButtons("radio_choose", "Choose One", choices = c("Year", "Numbers")),

    checkboxGroupInput("checkbox_years", "Year", choices = c(1995, 1996, 1997, 1997)),

    checkboxGroupInput("checkbox_numbers", "Numbers", choices = c(1, 2, 3))

))

server <- function(input, output, session) {

    #Observe the radio buttons (runs when the radio button changes)
    observeEvent(input$radio_choose, {

        if(input$radio_choose == "Year") {

            shinyjs::show("checkbox_years")
            shinyjs::hide("checkbox_numbers")

        }

        if(input$radio_choose == "Numbers") {

            shinyjs::hide("checkbox_years")
            shinyjs::show("checkbox_numbers")

        }

    })

}

shinyApp(ui, server)
Mariellemariellen answered 23/4, 2020 at 21:0 Comment(3)
Thanks for the Answer. Your Answer has added a new Perspective. I have a doubt. The choices in CheckboxGroupInput() are dynamic in my case. So i will not be able to give this choices in UI(). Is there anyway to over this problem ?Tussore
Sure, updateCheckboxGroupInput will let you change the choices dynamically. Use the code I provided above and add updateCheckboxGroupInput.Mariellemariellen
Hi Thanks for the Suggestion Ash. I used the updateCheckboxGroupInput, I am receiving the error " Error in as.vector: cannot coerce type 'environment' to vector of type 'character' ". I am not sure why this particular issue is taking place. I am confused on this.Tussore
W
1

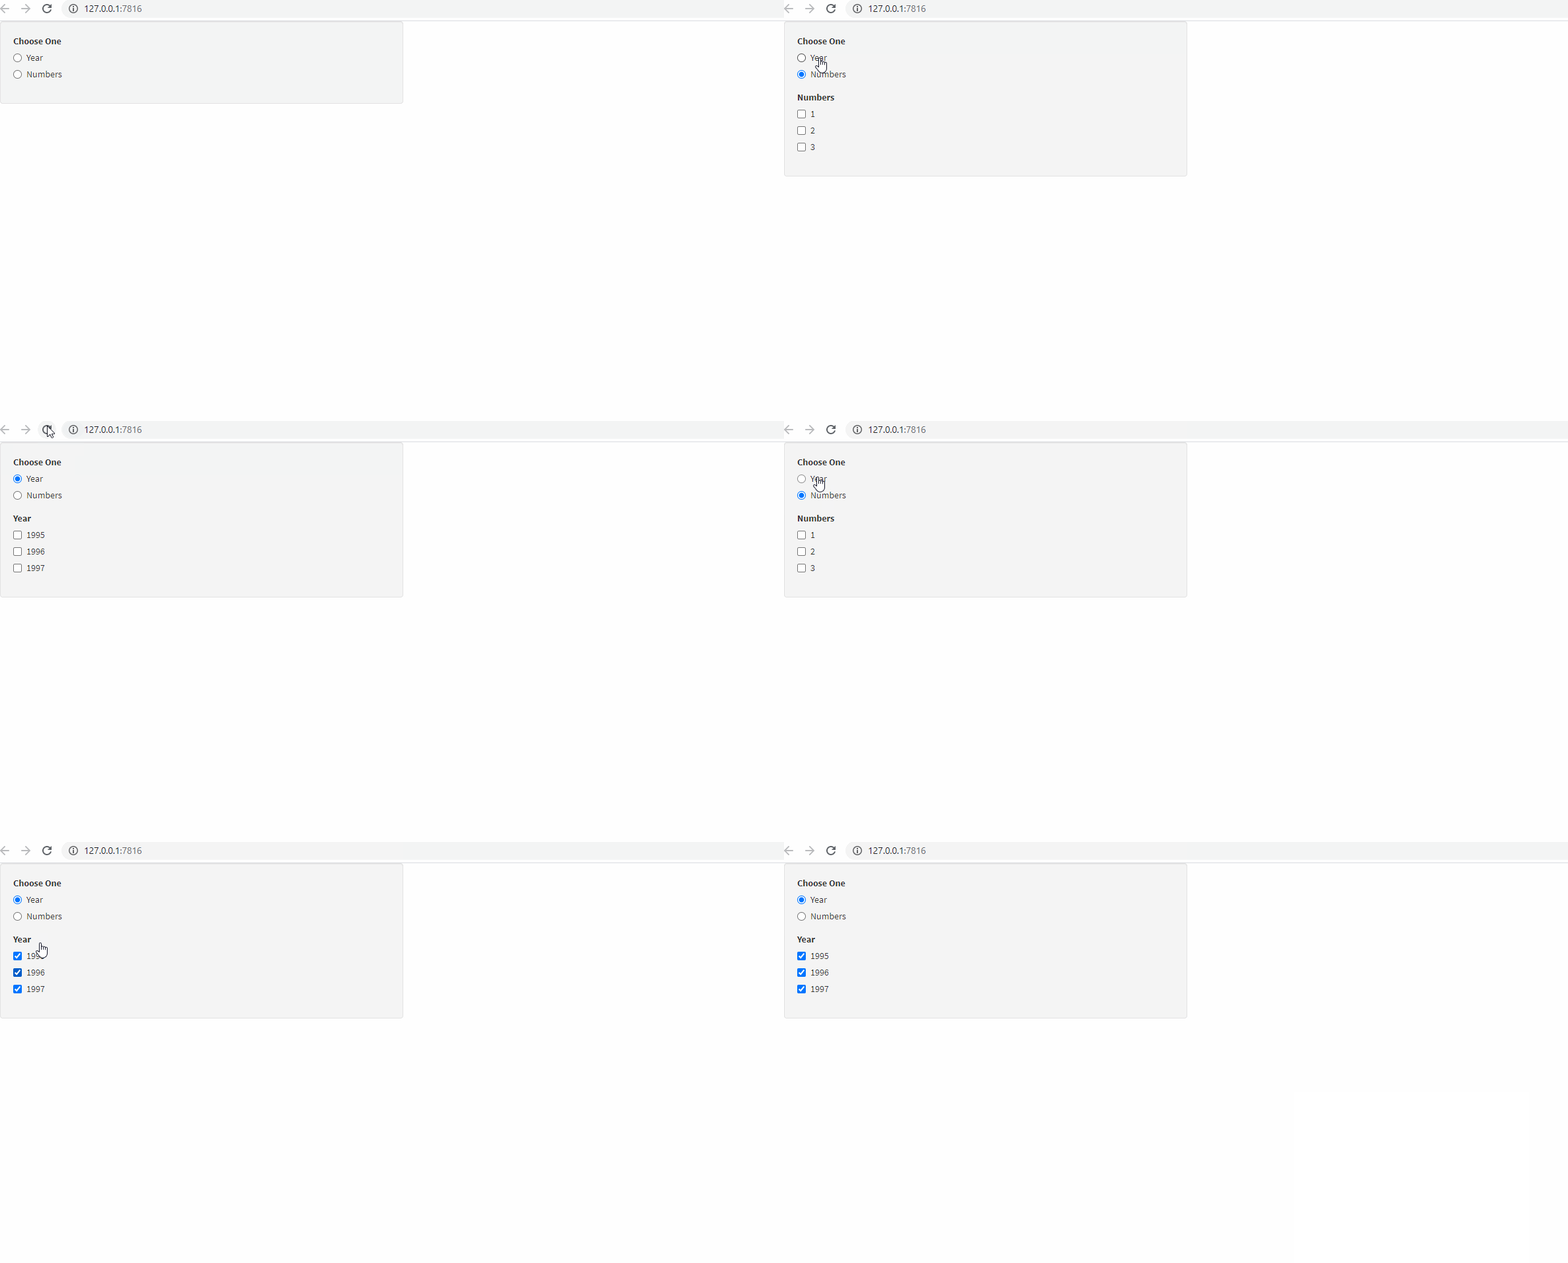
Here is my approach to this, using hidden from shinyjs. I've also added default selection to be empty so there is no ambiguity in reactivity. Do try to avoid using numerical variables on their own in names, such as "1", "2" and so on

library(shiny)
library(shinydashboard)
library(shinyWidgets)
library(shinyjs)

d <- data.frame(
    year = c(1995, 1995, 1995, 1996, 1996, 1996, 1997, 1997, 1997),
    Product_Name = c("Table","Chair","Bed","Table","Chair","Bed","Table","Chair","Bed"),
    Product_desc = c("X", "X", "X", "Y", "Y", "Y", "Z", "Z", "Z"),
    Cost = c(1, 2, 3, 4, 2, 3, 4, 5, 6)
)

ui <- shinyUI(fluidPage(
    useShinyjs(),
    useShinydashboard(),
    tabPanel("Plot",
             sidebarLayout(
                 sidebarPanel(
                     radioButtons("Choose","Choose One", c("Year" = "p", "Numbers" = "b"),selected = character(0)),
                     uiOutput('checkbox'),
                     position = "bottom"),
                 mainPanel(
                     uiOutput("graph")
                 )

             )
    )
))

server <- function(input, output, session) {

    output$checkbox <- renderUI({
        hidden(
            tagList(
                checkboxGroupInput("Cross","Year",choices = (unique(d$year))),
                checkboxGroupInput("Cross_1","Numbers",choices = c("1","2","3"))
            )
        )
    })

    observeEvent(input$Choose,{
        toggleElement(id = "Cross", condition = input$Choose == "p")
        toggleElement(id = "Cross_1", condition = input$Choose == "b")
    })

}

shinyApp(ui, server)

enter image description here

Alternatively, since radioButtons default to select the first value you can hide the second element:

ui <- shinyUI(fluidPage(
    useShinyjs(),
    useShinydashboard(),
    tabPanel("Plot",
             sidebarLayout(
                 sidebarPanel(
                     radioButtons("Choose","Choose One", c("Year" = "p", "Numbers" = "b")),
                     uiOutput('checkbox'),
                     position = "bottom"),
                 mainPanel(
                     uiOutput("graph")
                 )

             )
    )
))

server <- function(input, output, session) {

    output$checkbox <- renderUI({
        tagList(
            checkboxGroupInput("Cross","Year",choices = (unique(d$year))),
            hidden(checkboxGroupInput("Cross_1","Numbers",choices = c("1","2","3")))
        )
    })

    observeEvent(input$Choose,{
        toggleElement(id = "Cross", condition = input$Choose == "p")
        toggleElement(id = "Cross_1", condition = input$Choose == "b")
    })

}

shinyApp(ui, server)
Weinert answered 19/6, 2020 at 13:5 Comment(1)
Thank you so much :) Your Answer has given me a New perspective on how to handle this issue. Now i am able to retain the values. But I am not able to get the graphs in the main panel as the Checkbox Selection under the two radio buttons. Can you please help me on this. I have posted a Separate question explaining the issue which I am facing. stackoverflow.com/q/62441281/11104327 You suggestions would help me a lot on this.Tussore

© 2022 - 2024 — McMap. All rights reserved.