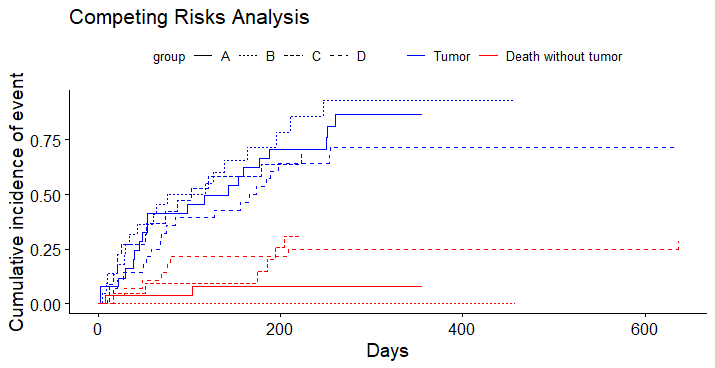
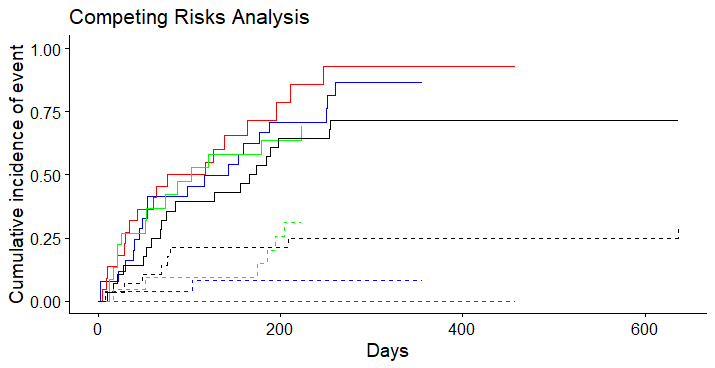
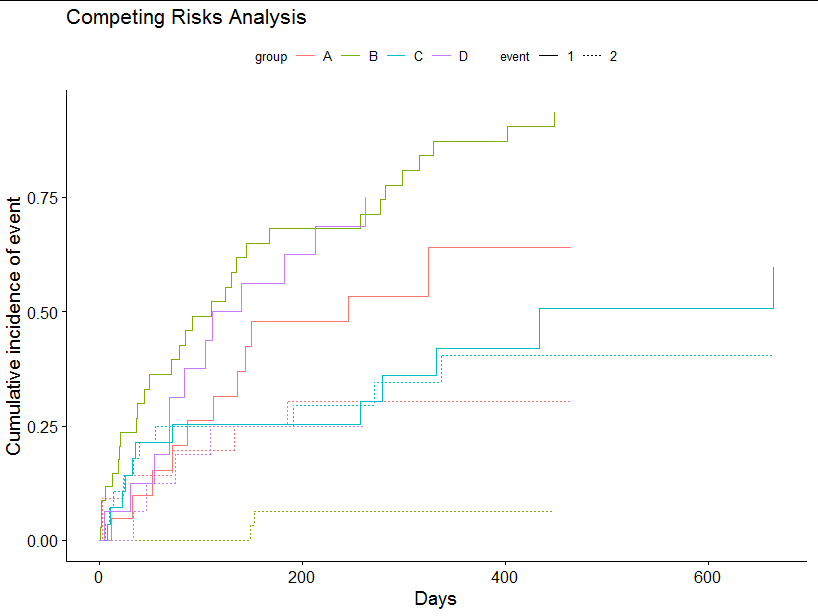
I am trying to customize a plot for competing risks using R and the package cmprsk. Specifically, I want to overwrite the default that for competing events colors are used and for different groups linetypes are used.
Here is my reproducible example:
library(ggplot2)
library(cmprsk)
library(survminer)

# some simulated data to get started
comp.risk.data <- data.frame("tfs.days" = rweibull(n = 100, shape = 1, scale = 1)*100,
                             "status.tfs" = c(sample(c(0,1,1,1,1,2), size=50, replace=T)),
                             "Typing" = sample(c("A","B","C","D"), size=50, replace=T))

# fitting a competing risks model
CR <- cuminc(ftime = comp.risk.data$tfs.days,
             fstatus = comp.risk.data$status.tfs,
             cencode = 0,
             group = comp.risk.data$Typing)

# the default plot makes it impossible to identify the groups
ggcompetingrisks(fit = CR, multiple_panels = F, xlab = "Days", ylab = "Cumulative incidence of event",title = "Competing Risks Analysis")+
  scale_color_manual(name="", values=c("blue","red"), labels=c("Tumor", "Death without tumor"))
Using ggplot_build() I managed to change the default regarding linetype and color, but I cannot find a way to add a legend.
p2 <- ggcompetingrisks(fit = CR, multiple_panels = FALSE, xlab = "Days", ylab = "Cumulative incidence of event",title = "Death by TCR", ylim = c(0, 1)) +
  scale_color_manual(name="", values=c("blue","red"), labels=c("Tumor", "Death without tumor"))

q <- ggplot_build(p2)
q$data[[1]]$colour2 <- ifelse(q$data[[1]]$linetype=="solid","blue", ifelse(q$data[[1]]$linetype==22,"red",  ifelse(q$data[[1]]$linetype==42,"green",  ifelse(q$data[[1]]$linetype==44,"black", NA))))
q$data[[1]]$linetype <- ifelse(q$data[[1]]$colour=="blue","solid", ifelse(q$data[[1]]$colour=="red","dashed", NA))
q$data[[1]]$colour <- q$data[[1]]$colour2

q$plot <- q$plot + ggtitle("Competing Risks Analysis") + guides(col = guide_legend()) + theme(legend.position = "right")


p2 <- ggplot_gtable(q)
plot(p2)
Does anyone know how to add the legend to a plot manipulated by ggplot_build()? Or an alternative way to plot the competing risks such that color indicated group and linetype indicates event?


survminer::ggcompetingrisksor more specificallysurvminer:::ggcompetingrisks.cuminc? – Galyak