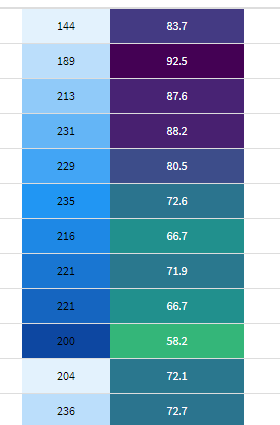
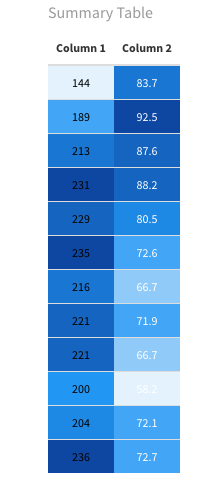
I have simple RMarkdown document exporting in pdf containing a kablextra table with only 2 columns (see image). I'm trying to set the background of both columns to a shade of blue where high values are represented with a darker color and low values with a lighter color. The order of the values cannot change as they represent monthly figures. As I was experimenting to find a solution, I managed to get the columns to have some background color (see image).
library(kableExtra)
library(paletteer)
library(tidyverse)

#two vectors

column_1<-c(144, 189, 213, 231, 229, 235, 216, 221, 221, 200, 204, 236)
column_2<-c(83.7, 92.5, 87.6, 88.2, 80.5, 72.6, 66.7, 71.9, 66.7, 58.2, 72.1, 72.7)


#create dataframe
activity<-data.frame (column_1, column_2)

#create kableextra summary table

kbl(activity, booktabs = T, linesep = "",  col.names = linebreak(c("Column 1", "Column 2")), align = "c", caption = "Summary Table") %>%
  kable_styling(full_width = F) %>%
  kable_styling(font_size = 12, position = "center") %>%
  kable_styling(latex_options = "hold_position") %>%
  column_spec(1, color = "black", background = paletteer_d("ggsci::blue_material")) %>%
  column_spec(2, color = "white", background = spec_color(activity$column_1, end = 0.9, option = "viridis", direction = -1))
The left column is using the following code and is exactly the color I want but I can't get it to highlight values properly (high with dark and low with light color - as mentioned above I can't sort the low to high as they are timeseries data):
column_spec(1, color = "black", background = paletteer_d("ggsci::blue_material")) %>%
The right column is highlighting high & low values exactly how I want it to but is not using the color I want! (people at work don't like it actually!)
column_spec(2, color = "white", background = spec_color(activity$column_2, end = 0.9, option = "viridis", direction = -1)) %>%
Is there an argument that can be added in the code of the left column to make it highlight high values with darker color etc like the right column does but without sorting the values in the column?
Thanks for taking the time to read my post
Regards
Dim


dput(your_data)into the question. – Katalin