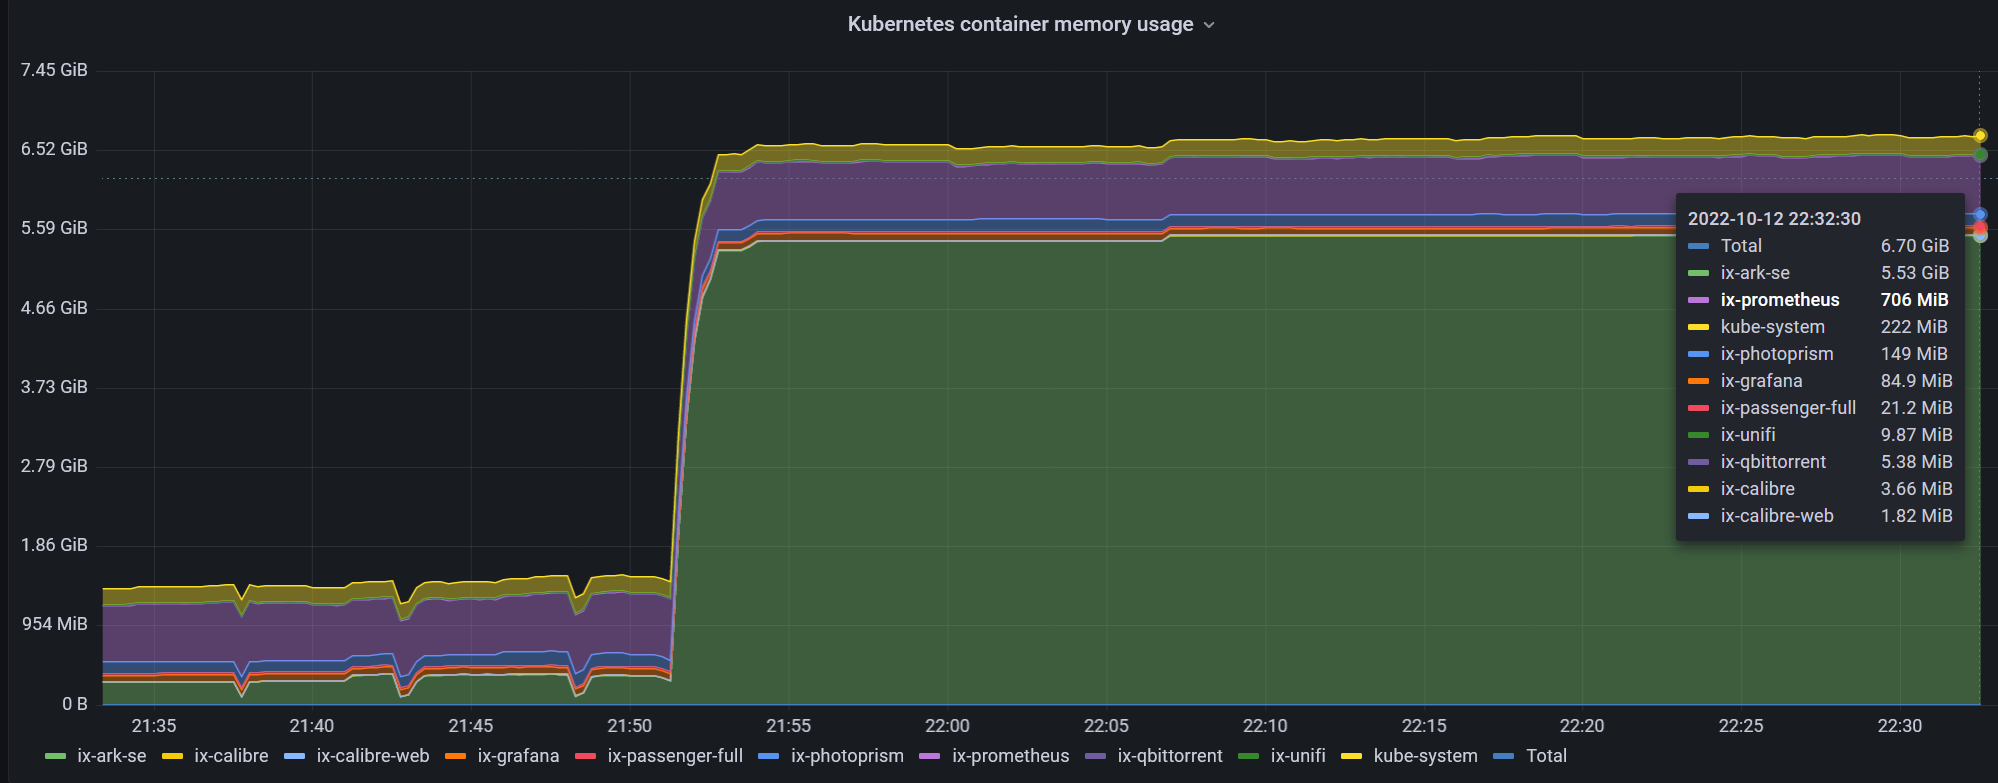
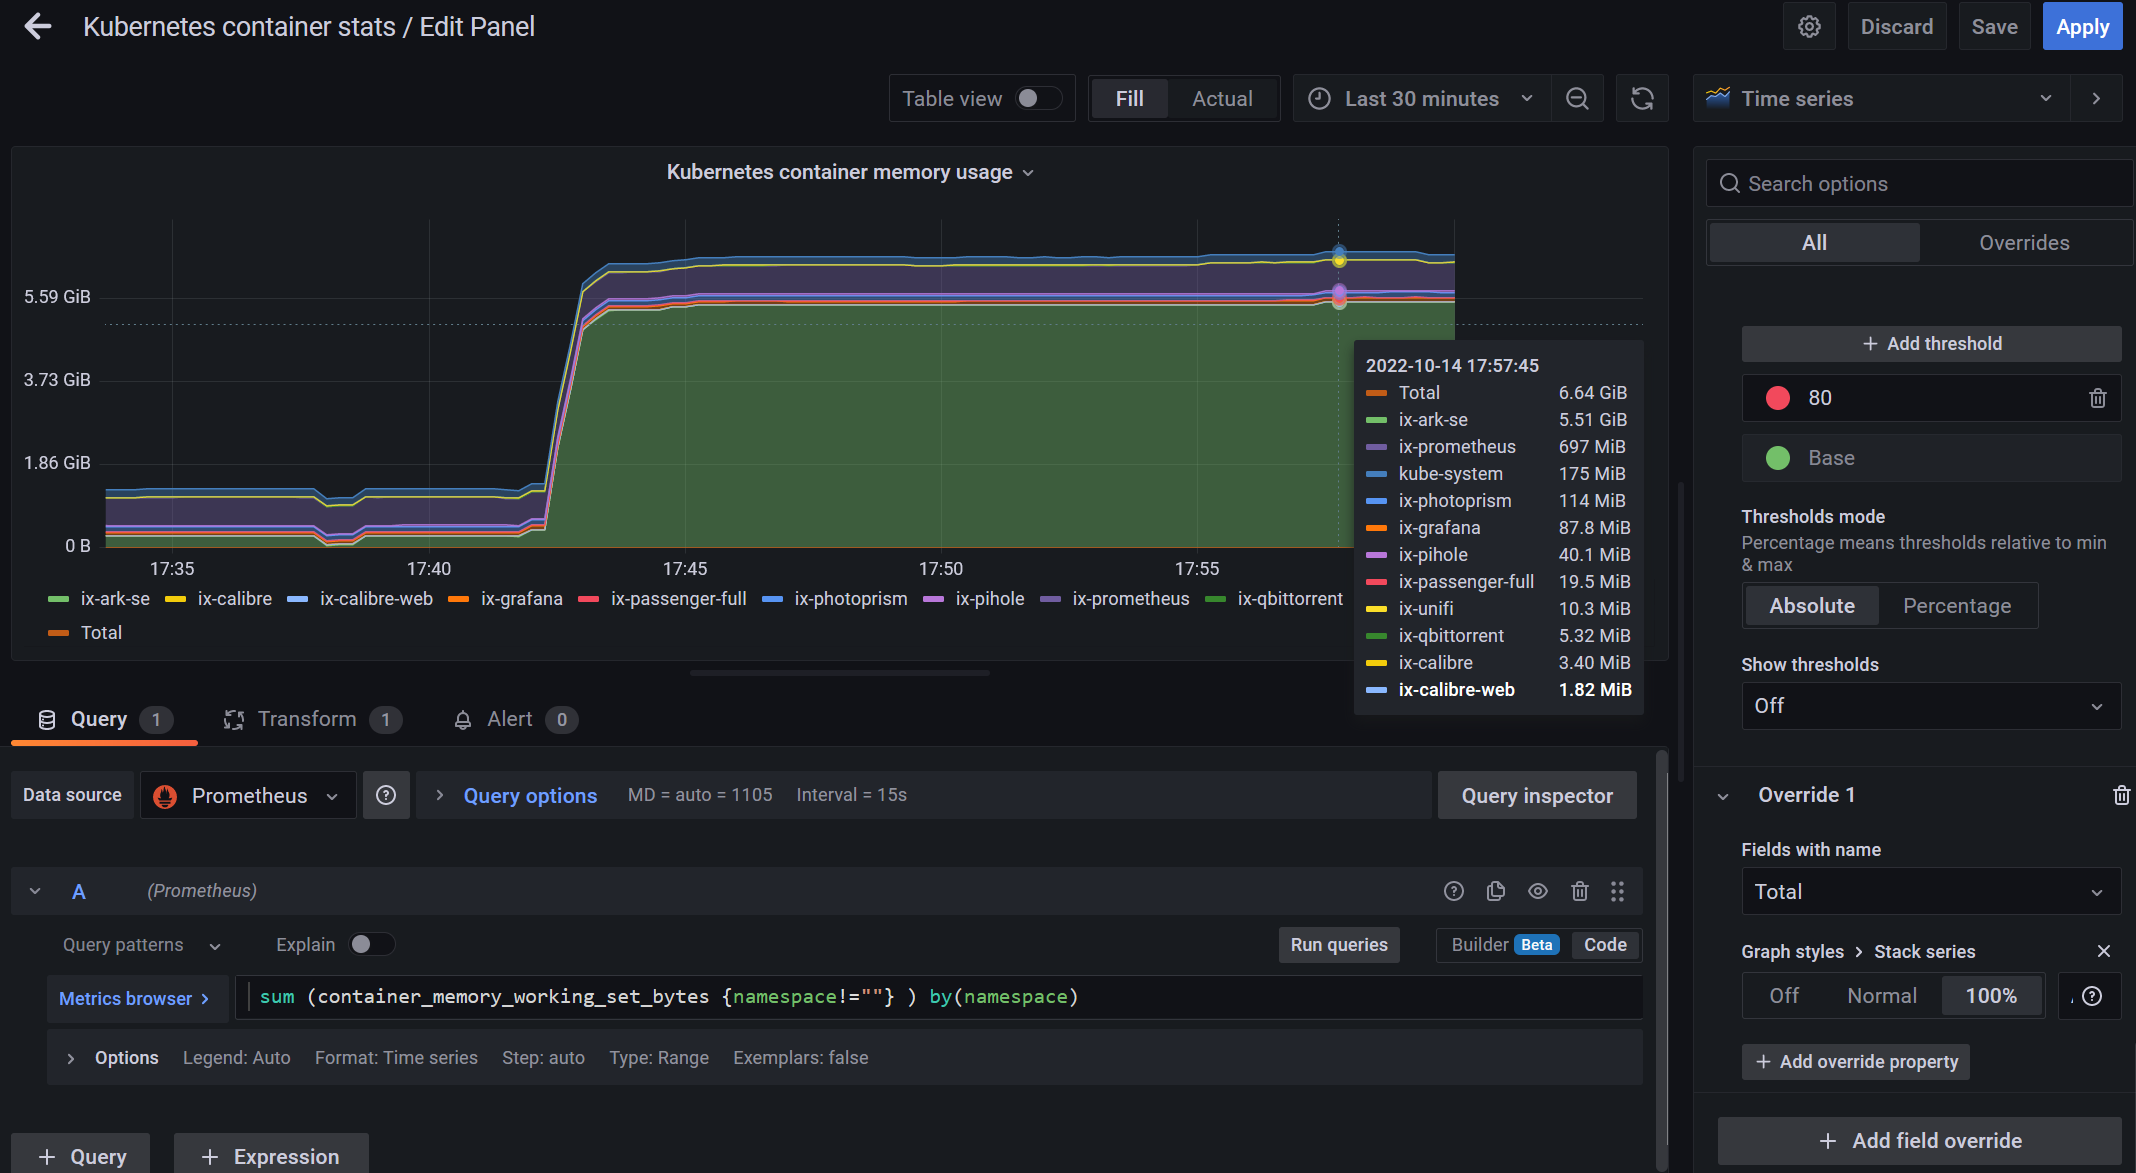
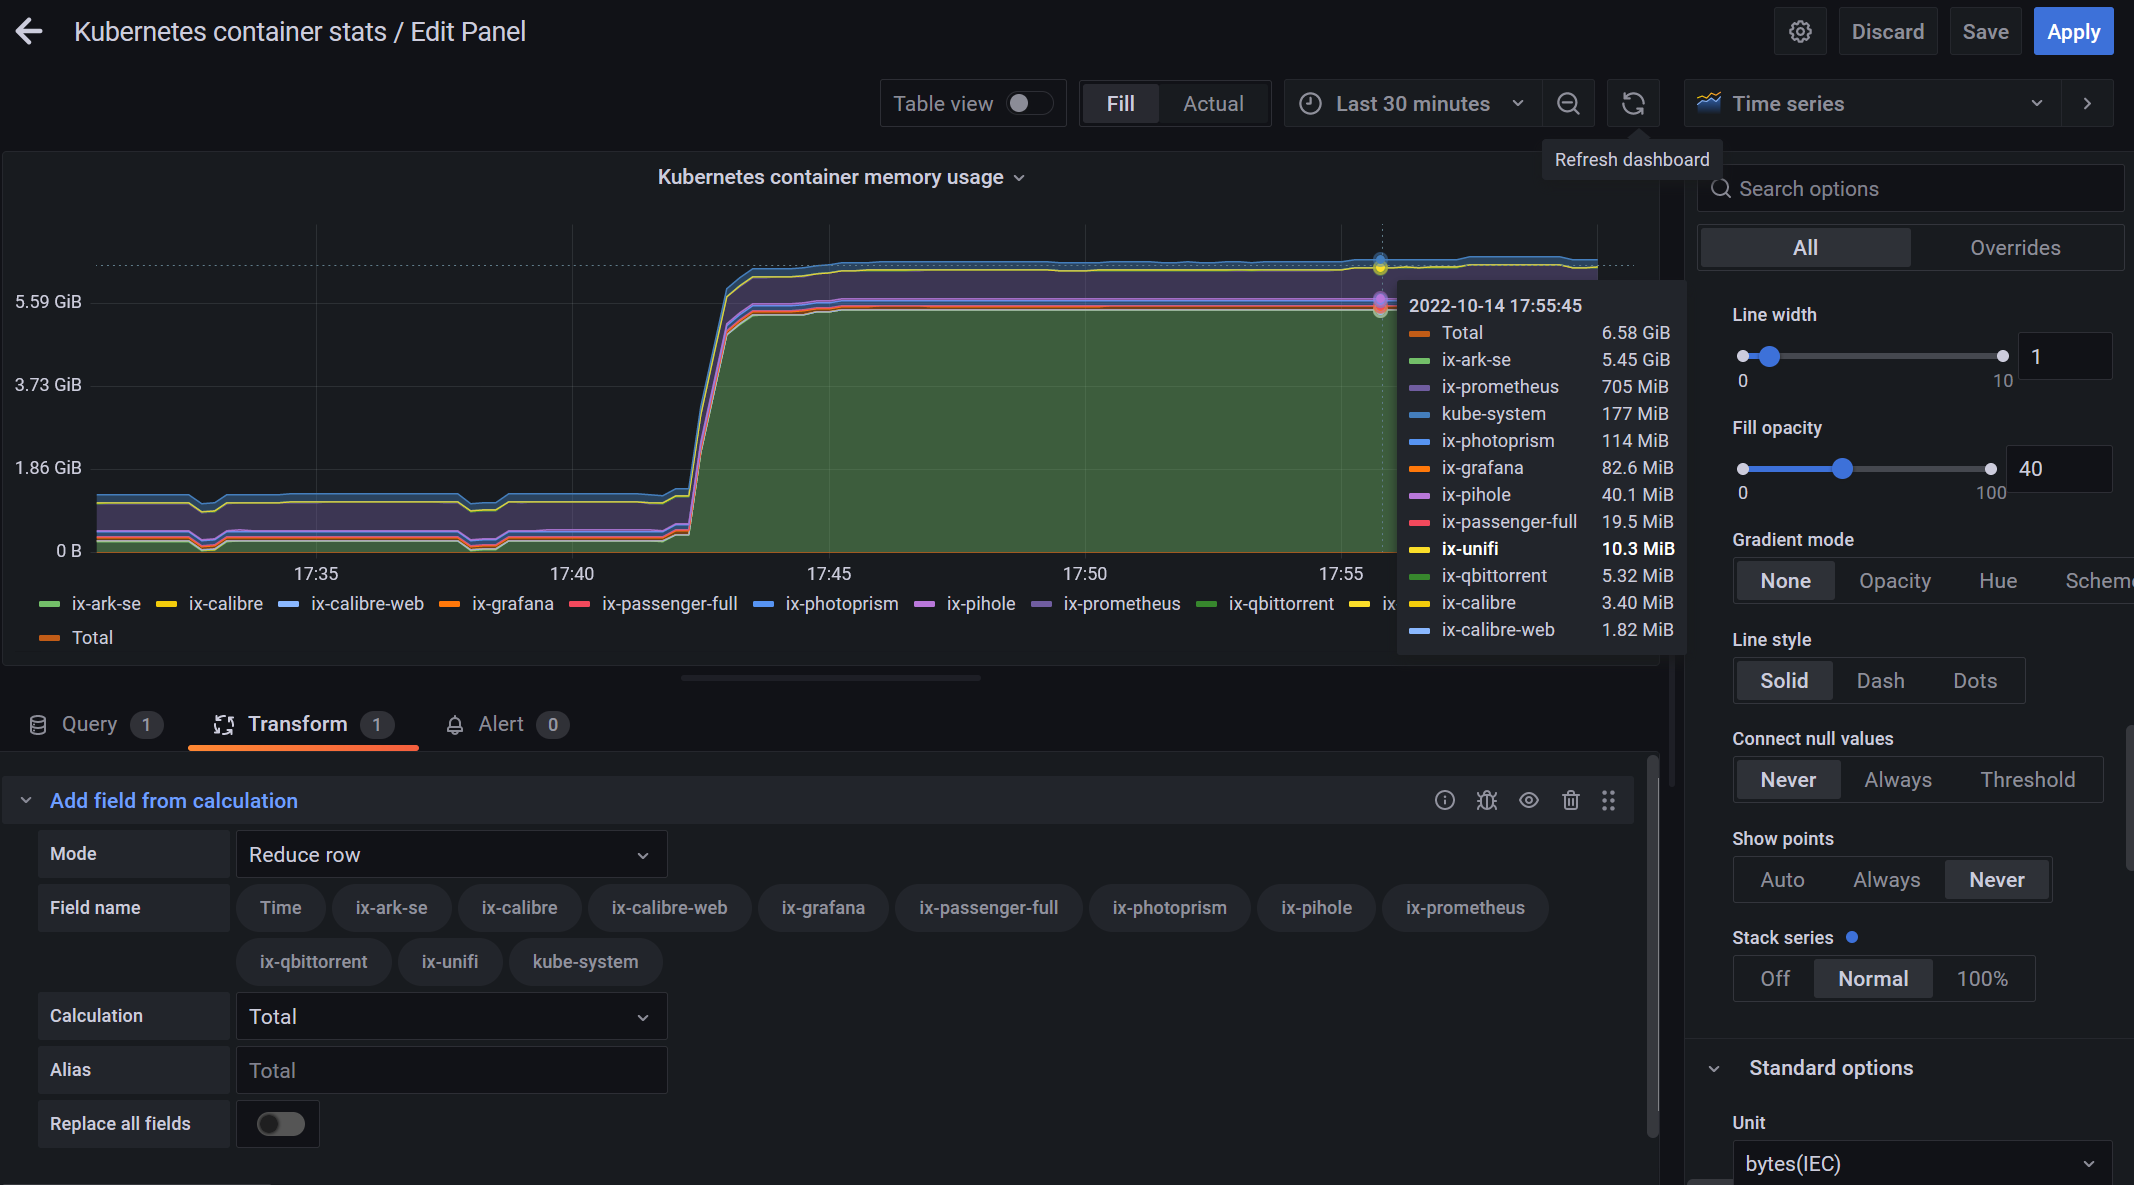
I have Kubernetes running (K3s on TrueNAS scale). I've deployed Prometheus and Grafana and am able to access the metrics in Grafana. I now want to create a stacked line chart that shows memory usage by namespace and total memory used by Kubenetes.
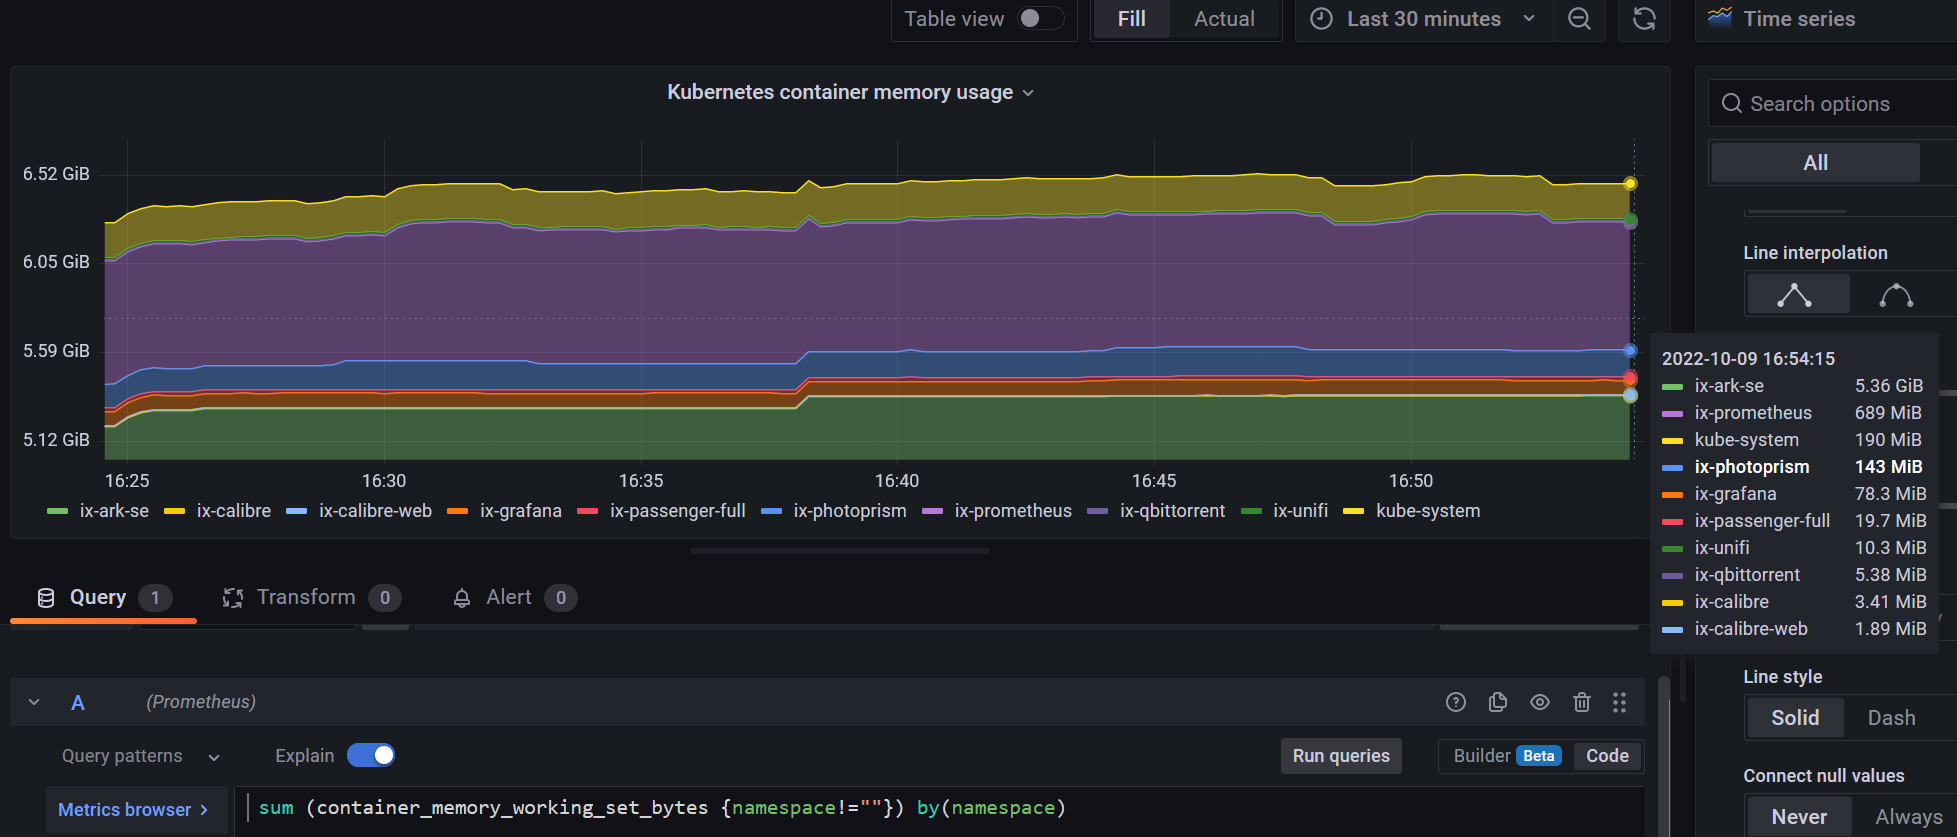
I got it working without the total with this query: sum (container_memory_working_set_bytes{namespace!=""}) by(namespace) (see screen shot 1).
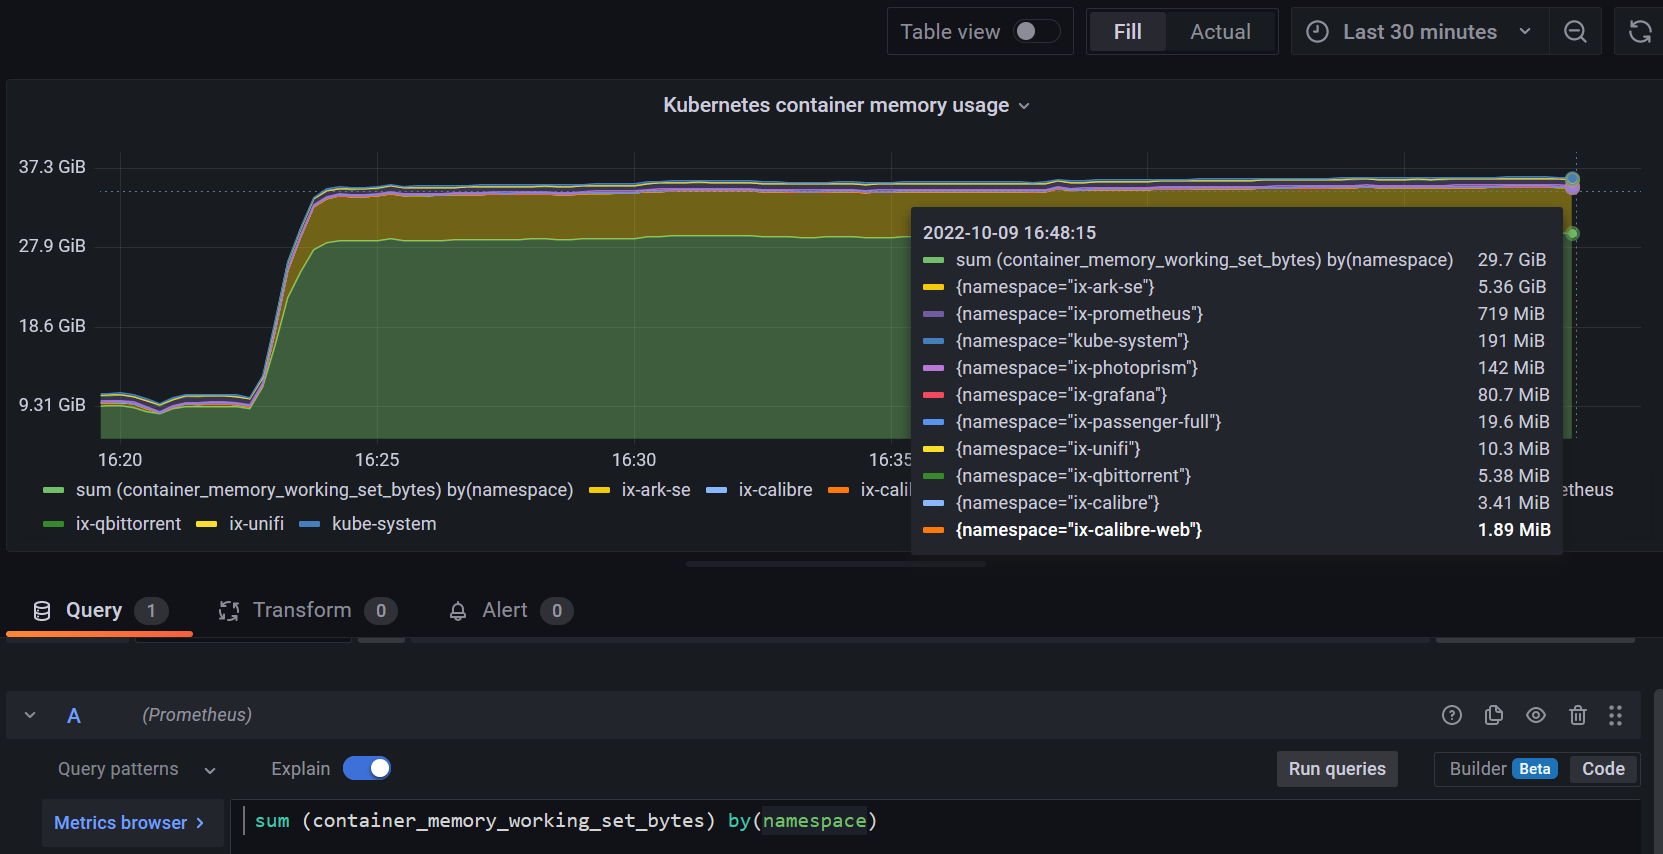
I needed to add the {namespace!=""} or it would add an entry with the same name as the query (see screen shot 2). Don't understand what that value represents, but its not the total I'm after!
How can I include a total of the memory used in the tooltip (without it appearing as a line in the chart)?

