How to skip nodes with NA value in ggsankey?
Asked Answered
P

2

5

Suppose I have this dataset (the actual dataset has 30+ columns and thousands of ids)

    df <- data.frame(id = 1:5,
              admission = c("Severe", "Mild", "Mild", "Moderate", "Severe"),
              d1 = c(NA, "Moderate", "Mild", "Moderate", "Severe"),
              d2 = c(NA, "Moderate", NA, "Mild", "Moderate"),
              d3 = c(NA, "Severe", NA, "Mild", NA),
              d4 = c(NA, NA, NA, "Mild", NA),
              outcome = c("Dead", "Dead", "Alive", "Alive", "Dead"))

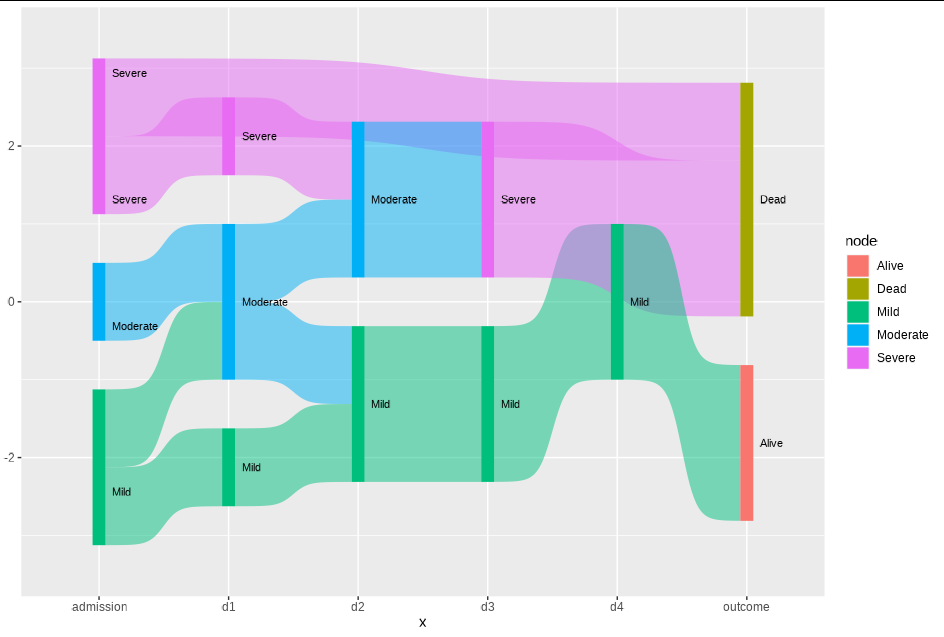
I want to make a Sankey diagram that illustrates the daily severity of the patients over time. However, when the observation reaches NA (means that an outcome has been reached), I want the node to directly link to the outcome.

This is how the diagram should look like: enter image description here
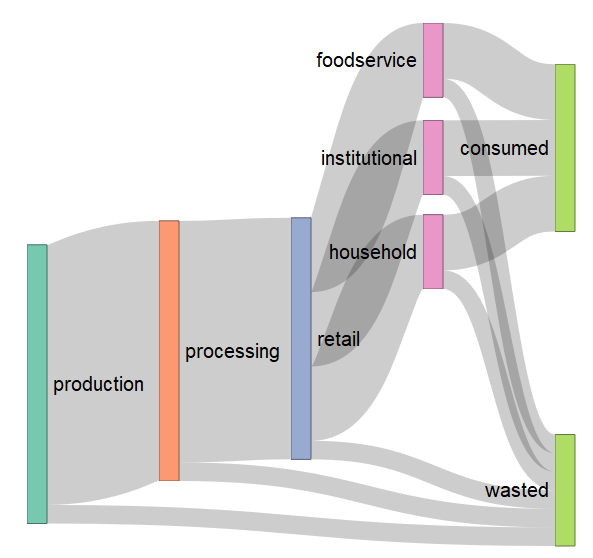
Image fetched from the question asked by @qdread here

Is this possible with ggsankey?

This is my current code:

df.sankey <- df %>%
    make_long(admission, d1, d2, d3, d4, outcome)
ggplot(df.sankey, aes(x = x,
                     next_x = next_x,
                     node = node,
                     next_node = next_node,
                     fill = factor(node),
                     label = node)) +
    geom_sankey(flow. Alpha = 0.5,
                node. Color = NA,
                show. Legend = TRUE) +
    geom_sankey_text(size = 3, color = "black", fill = NA, hjust = 0, position = position_nudge(x = 0.1))

EDIT Based on the solution provided by @Allan Cameron, I managed to bypass the nodes with NA values. However, the diagram looks quite complex because the links to the targets are not sorted.

    do.call(rbind, apply(df, 1, function(x) {
    x <- na.omit(x[-1])
    data.frame(x = names(x), node = x, 
               next_x = dplyr::lead(names(x)), 
               next_node = dplyr::lead(x), row.names = NULL)
})) %>%
    ggplot(df.sankey, aes(x = x,
                          next_x = next_x,
                          node = node,
                          next_node = next_node,
                          fill = factor(node),
                          label = node)) +
    geom_sankey(flow.alpha = 0.5,
                node.color = NA,
                show.legend = TRUE) +
    geom_sankey_text(size = 3, color = "black", fill = NA, hjust = 0, position = position_nudge(x = 0.1))

which results in this diagram: enter image description here
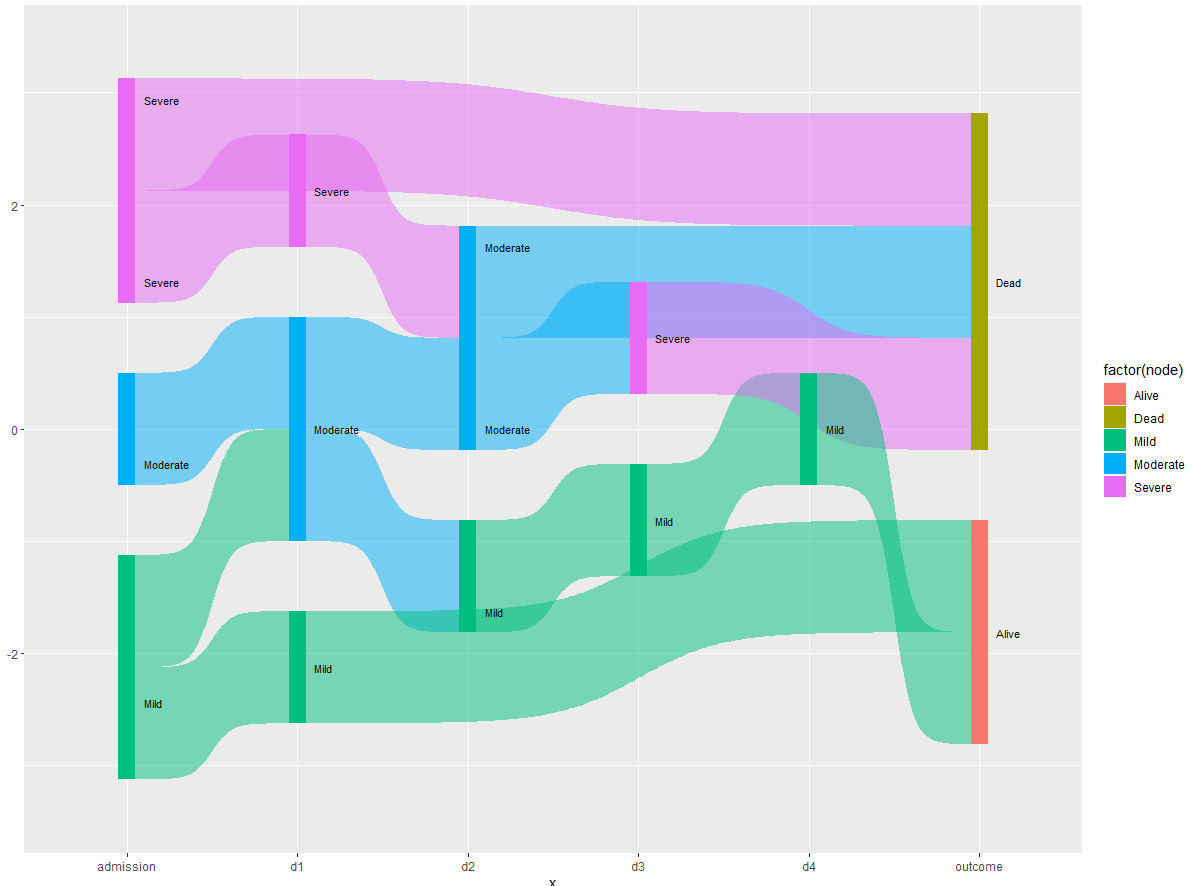
Is it possible to sort the links to the Outcome target so that all links with Severe value gets aggregated?

Thanks in advance for the help.

Post answered 20/10, 2022 at 14:12 Comment(0)
A
5

You just need to reshape your data "manually", since make_long doesn't do what you need here.

  do.call(rbind, apply(df, 1, function(x) {
    x <- na.omit(x[-1])
    data.frame(x = names(x), node = x, 
               next_x = dplyr::lead(names(x)), 
               next_node = dplyr::lead(x), row.names = NULL)
    })) %>%
    mutate(x = factor(x, names(df)[-1]),
           next_x = factor(next_x, names(df)[-1])) %>%
    ggplot(aes(x = x,
               next_x = next_x,
               node = node,
               next_node = next_node,
               fill = node,,
               label = node)) +
    geom_sankey(flow.alpha = 0.5,
                node.color = NA,
                show.legend = TRUE) +
    geom_sankey_text(size = 3, color = "black", fill = NA, hjust = 0, 
                     position = position_nudge(x = 0.1))

enter image description here

Ap answered 20/10, 2022 at 14:45 Comment(4)
Thanks! This is what I've been looking for! Do you perhaps have any insights on how to sort the direct links in the Outcome vertical bar? Since the real dataset has tens of columns, the branches looks too complex as they are not sortedPost
Update: sorry for the additional request, I have updated the dataset and the line of codes to illustrate the issue. Is it possible to sort the nodes?Post
@Post I don't think this is possible within the ggsankey interface, since most of the position choices are hard-coded within StatSankeyFlow, which is what actually calculates the polygons. What you are suggesting sounds like it would need to be hand-coded, since the choices would need to be made based on a global understanding of the flows and how they should be arranged. I can see a way to do this manually, but it would be very complex and would probably be done purely within ggplot using polygons.Ap
You may possibly want to use the riverplot package. https://mcmap.net/q/223381/-sankey-diagrams-in-rMorphosis
I
1

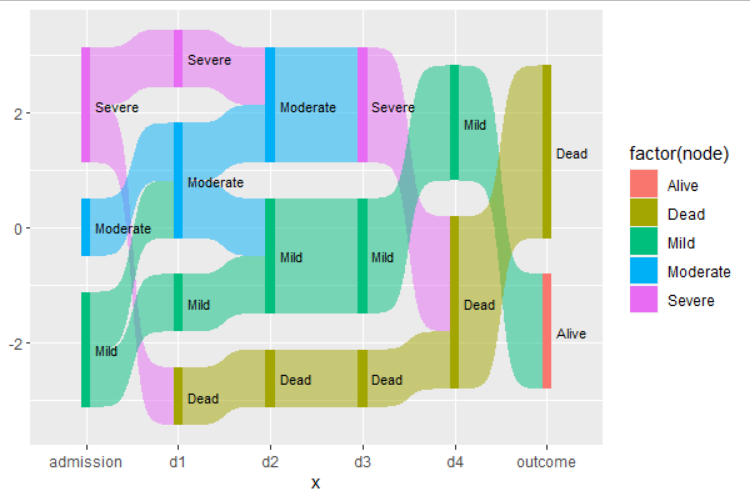
Move the outcome to the left, then plot:

library(ggplot2)
library(dplyr)
library(ggsankey)

# fill NAs from last value
df[] <- t(apply(df, 1, zoo::na.locf, fromLast = TRUE))

head(df)
#   id admission       d1       d2     d3   d4 outcome
# 1  1    Severe     Dead     Dead   Dead Dead    Dead
# 2  2      Mild Moderate Moderate Severe Dead    Dead
# 3  3      Mild     Mild     Mild   Mild Mild   Alive
# 4  4  Moderate Moderate     Mild   Mild Mild   Alive
# 5  5    Severe   Severe Moderate Severe Dead    Dead

# then your existing code
df.sankey <- df %>%
  make_long(admission, d1, d2, d3, d4, outcome)

# ggplot...

enter image description here

Isherwood answered 20/10, 2022 at 14:32 Comment(4)
Hi thanks for the quick answer! Is it possible to not fill the NAs with Dead and create a direct connection between the last non-blank column to the outcome? Because in the real dataset NA may also mean that the patient is discharged. Thanks in advance!Post
@Post then fill in the NAs with "discharged". But yes, there must be a way.Isherwood
@Post thinking a bit more, then "discharged" should be in the outcome column.Isherwood
Thanks for the feedback. Yes, I think it's also worthwhile to distinct those inpatients that are Alive at censoring and those that are already discharged at censoring. In the current form, both are coded as AlivePost

© 2022 - 2024 — McMap. All rights reserved.