I need to know how to make charts/graphs in Blackberry 10 Cascades Beta 3 SDK, QML, Qt, C++. If anyone can show me an example or point me to something that shows me how to do this, it would be much appreciated.
You should check out QChart.js:
http://jwintz.me/blog/2014/02/15/qchart-dot-js-qml-binding-for-chart-dot-js/
https://github.com/jwintz/qchart.js

Update The Qt Company will release QtCharts in 5.7 under GPL http://blog.qt.io/blog/2016/01/13/new-agreement-with-the-kde-free-qt-foundation/
One way to create graphs im Qt and QML is to add a Webview and use html library to display graphs. I have used flot and found it quite flexible.
Here is simple QML wrapper for QCustomPlot: https://github.com/ncp1402/ql-lineplot
This is an old question, but as for me, it was worth to wait.
At this moment there is Qt 5.7.0 Released. Among other new features there are:
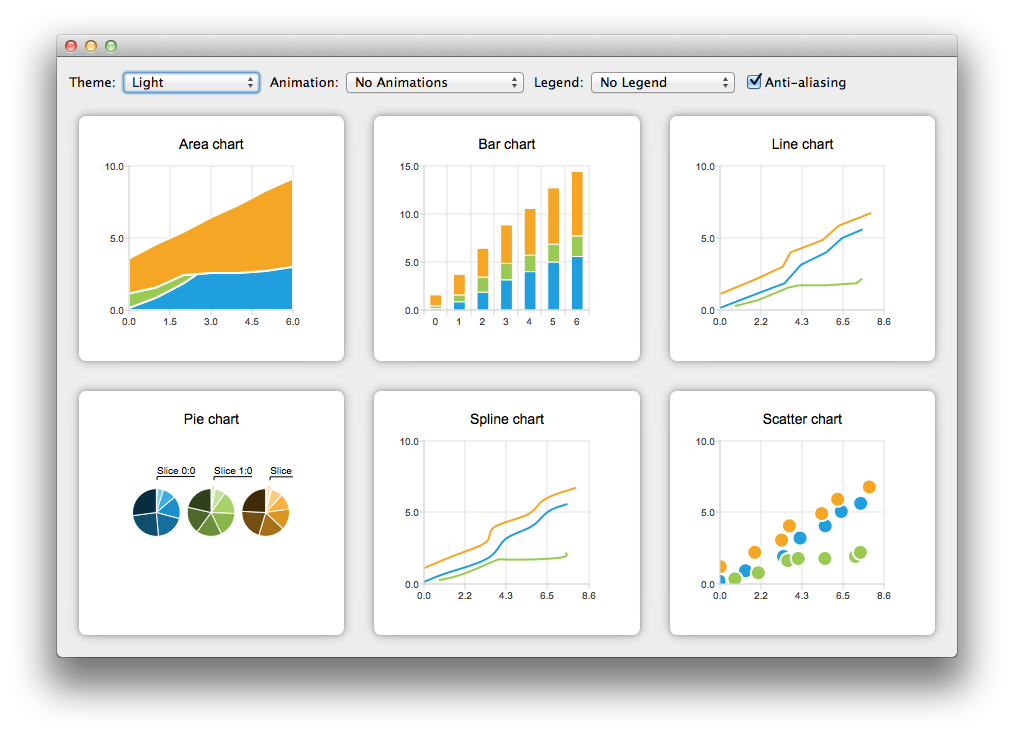
- Qt Charts. Previously commercial-only Qt Charts module is now included in Qt under also GPLv3 license for open source users.
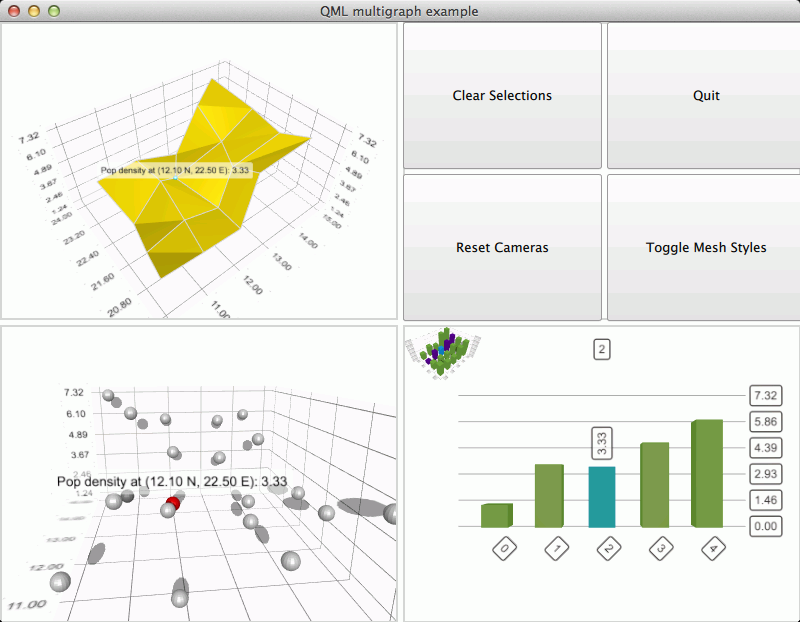
- Qt Data Visualization. Previously commercial-only Qt Data Visualization module is now included in Qt under also GPLv3 license for open source users.
If someone is interested, here is good place to start:
As suggested already, use the WebView object to host your graphs library, you'll find way more libraries to use with it than natively.
From personal experience, I can tell that http://www.highcharts.com/ works very well with Playbook OS and Blackberry 10 OS
well i am also looking for solution.
if it is simple plot then maybe you can create ImagePaint with ImagePaintData. very simple example is shown here: https://developer.blackberry.com/cascades/reference/bb_cascades_imagepaint.html
It is also possible to render a chart and seve it as Png for example; Then you could display this as an Image in QML also;
Another option is to use foreign window as described here: https://developer.blackberry.com/cascades/files/webinars/cascades_opengl_webcast.pdf
you could use opengl to render graphics, or try to compile chart library
Well- web browser controll seem like the easiest sollution,and i thinnk that i will try it.
I tried this. Not every Charts library wors on bb10 simulator. For exaple flot , wich was mentioned earlier doesn't work. but some libraries works . for example highCharts and http://elycharts.com/
If you need something in C++ using QT you might have a look at QWT http://qwt.sourceforge.net/index.html
Chart.js 2 is a nice library that offers a ton of different graphs with animations, many options and an easy interface. We have written a QML adapter for it. Qt charts is also nice but it can only be used with GPL or commercial QT license. Our adapter and Chart.js 2 both are MIT-licensed.
Maybe, it's helpful for you and others: https://github.com/Elypson/ChartJs2QML
© 2022 - 2024 — McMap. All rights reserved.


