I want to plot some interpolating data on a projected map using ggplot2 and I have been working on this problem for a few weeks. Hope someone can help me, thanks a lot. The shapefile and data can be found at https://www.dropbox.com/s/8wfgf8207dbh79r/gpr_000b11a_e.zip?dl=0 and https://www.dropbox.com/s/9czvb35vsyf3t28/Mydata.rdata?dl=0 .
First, the shapefile is originally using "lon-lat" projection and I need to convert it to Albers Equal Area (aea) projection.
library(automap)
library(ggplot2)
library(rgdal)
load("Mydata.rdata",.GlobalEnv)
canada2<-readOGR("gpr_000b11a_e.shp", layer="gpr_000b11a_e")
g <- spTransform(canada2, CRS("+proj=aea +lat_1=50 +lat_2=70 +lat_0=40 +lon_0=-96 +x_0=0 +y_0=0 +datum=NAD83 +units=m +no_defs +ellps=GRS80 +towgs84=0,0,0"))
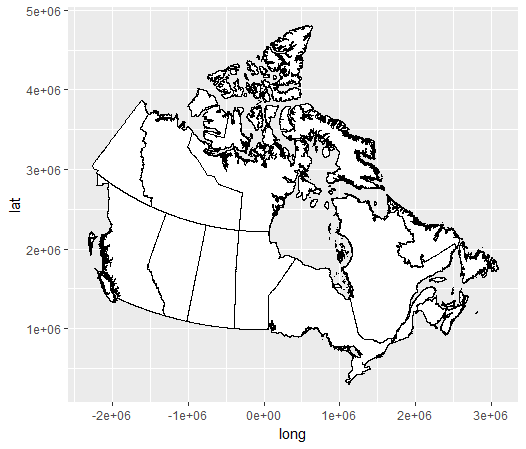
Borders=ggplot() +geom_polygon(data=g,aes(x=long,y=lat,group=group),fill='white',color = "black")
Borders
As we can see, we can plot the country correctly. Then I want to interpolate the data using Kriging method, the code is taken from Smoothing out ggplot2 map.
coordinates(Mydata)<-~longitude+latitude
proj4string(Mydata)<-CRS("+proj=longlat +datum=NAD83")
sp_mydata<-spTransform(Mydata,CRS(proj4string(g)))
Krig=autoKrige(APPT~1,sp_mydata)
interp_data = as.data.frame(Krig$krige_output)
colnames(interp_data) = c("latitude","longitude","APPT_pred","APPT_var","APPT_stdev")
interp_data=interp_data[,1:3]
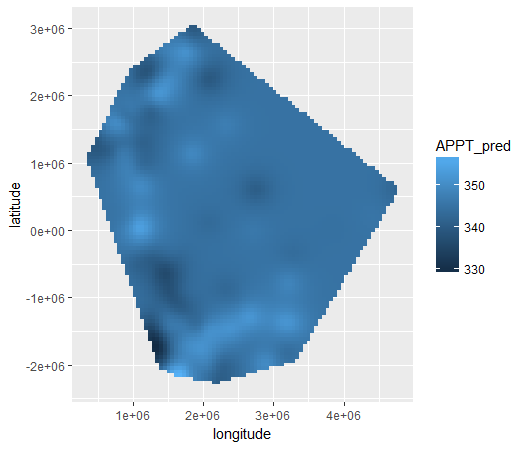
ggplot(data=interp_data, aes(x=longitude, y=latitude)) + geom_tile(aes(fill=APPT_pred),color=NA)
Then we can see the interpolating data map.

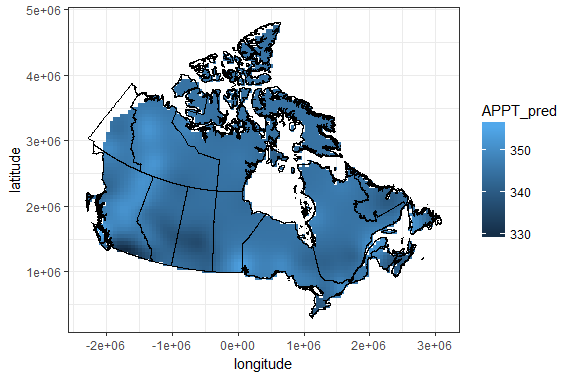
Finally I want to combine these two figures and then I get the following error: Error: Don't know how to add o to a plot
ggplot(data=interp_data, aes(x=longitude, y=latitude)) + geom_tile(aes(fill=APPT_pred),color=NA)+Borders
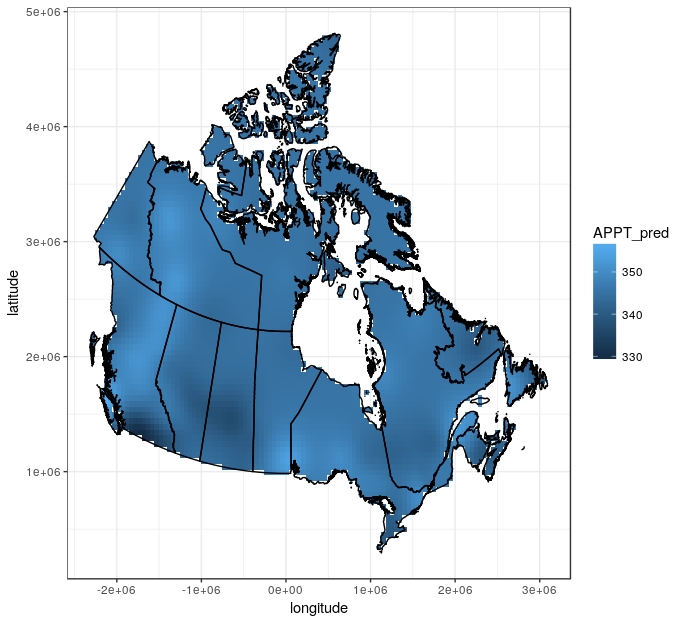
My question is: how can I plot the interpolating data on the map and then add grid lines (longitude and latitude). Also, I wonder how to clip the interpolating data map to fit the whole Canada map. Thanks for the help.


interp_dataobject. – Raimondo+two objects created withggplot(), so noggplot() + geom_x() + ggplot() + geom_y(). You can only add new layers. – Alvarez