How to adjust the margins of a single plot inside a layout in R?
Asked Answered
Y

1

5

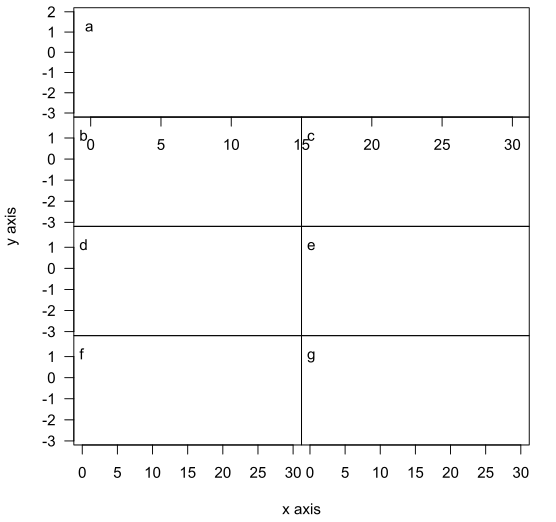
I have a layout formed by 7 plots, one at the top and the other 6 spread in 3x2 matrix below the first one. In my layout the plots are completely together and I'd like to left a little gao between the first plot and the others. How can I do this in R?

layout(matrix(c(1,1,2,3,4,5,6,7), 4, 2, byrow = T))

par(mar = c(0,0,0,0), oma = c(5,4,0.5,0.5), las =1)


plot(1:10, axes = T, type = "n", xlim = c(0,30), ylim = c(-3,2), las =1)
mtext(letters[1], side = 3, line = -1.5, adj = 0.025)

for (i in 2:7){
  plot(1:10, axes = F, type = "n", xlim = c(0,30), ylim = c(-3,1.8))
  mtext(letters[i], side = 3, line = -1.5, adj = 0.025)

  if (i %in% c(6,7))
    axis(side = 1)

  if (i %in% c(2,4,6))
    axis(side = 2)
  box()
}
mtext("x axis", side = 1, outer = TRUE, line = 3)
mtext("y axis", side = 2, outer = TRUE, line = 3, las = 3)

enter image description here

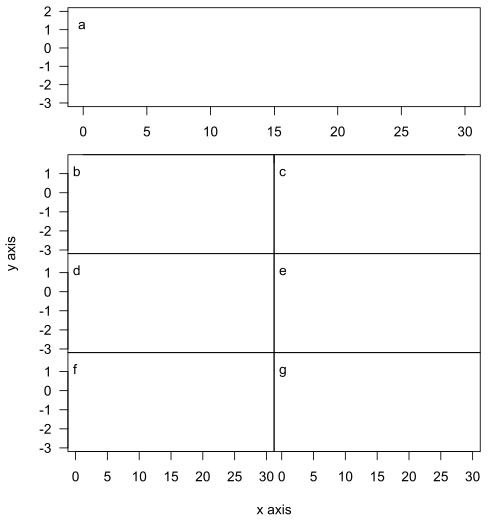
And I want something like

enter image description here

Yt answered 23/11, 2017 at 19:23 Comment(0)
Y
7

Before the first plot add a margin in the bottom axis

par(mar = c(2.5,0,0,0))

Then, begining the for delete this margin

par(mar = c(0,0,0,0))

Full code:

layout(matrix(c(1,1,2,3,4,5,6,7), 4, 2, byrow = T))

par(mar = c(0,0,0,0), oma = c(5,4,0.5,0.5), las =1)

par(mar = c(2.5,0,0,0)) #Add a space in the bottom axis

plot(1:10, axes = T, type = "n", xlim = c(0,30), ylim = c(-3,2), las =1)
mtext(letters[1], side = 3, line = -1.5, adj = 0.025)

for (i in 2:7){

  par(mar = c(0,0,0,0)) #delete the space in the bottom axis

  plot(1:10, axes = F, type = "n", xlim = c(0,30), ylim = c(-3,1.8))
  mtext(letters[i], side = 3, line = -1.5, adj = 0.025)

  if (i %in% c(6,7))
    axis(side = 1)

  if (i %in% c(2,4,6))
    axis(side = 2)
  box()
}
mtext("x axis", side = 1, outer = TRUE, line = 3)
mtext("y axis", side = 2, outer = TRUE, line = 3, las = 3)

enter image description here

Yt answered 23/11, 2017 at 20:9 Comment(0)

© 2022 - 2024 — McMap. All rights reserved.