Filling shapefile polygons with a color in matplotlib
Asked Answered
G

1

5

I am searching way to fill polygons of a shapefile based on a value. So far from basemap tutorial (http://basemaptutorial.readthedocs.io/en/latest/shapefile.html) i 've found how to fill the polygons with a specific color.

import matplotlib.pyplot as plt
import pypyodbc
from mpl_toolkits.basemap import Basemap
from matplotlib.patches import Polygon
from matplotlib.collections import PatchCollection
from matplotlib.patches import PathPatch
import numpy as np
 
fig= plt.figure()
ax= fig.add_subplot(111)
m=Basemap(projection='cyl',llcrnrlat=34.5,llcrnrlon=19,urcrnrlat=42,urcrnrlon=28.5,resolution='h')
m.drawmapboundary(fill_color='aqua')
m.fillcontinents(color='#ddaa66',lake_color='aqua')
m.drawcoastlines()
m.readshapefile('nomoi','nomoi')

patches   = []

for info, shape in zip(m.nomoi_info, m.nomoi):
    if info['ID_2'] == 14426:
        patches.append( Polygon(np.array(shape), True) )

ax.add_collection(PatchCollection(patches, facecolor='m', edgecolor='k', linewidths=1., zorder=2))

plt.show()

What I would like to do is taking values from a dictionary such as this:

dict1={14464: 1.16, 14465: 1.35, 14466: 1.28, 14467: 1.69, 14468: 1.81, 14418: 1.38}

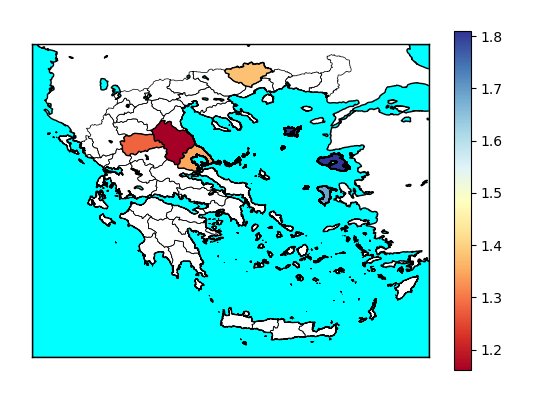
in which the keys are the info['ID_2'] column from the shapefile as in the code presented above and the values are the variable that i want to represent to color. Meaning to have a colormap varying from 1.16 to 1.81 and each polygon (ID_2) to have a color related to it's value from dict1.

Thanks in advance

Golgotha answered 30/1, 2018 at 11:32 Comment(2)
Where do I get the nomoi shapefile from?Keverne
I don't know where to upload it i hope this works drive.google.com/open?id=1Q47l1uSomLyDrHG2mxMiK3solsmWwcOdGolgotha
K
7

It seems you want to produce a choropleth plot in basemap.
To this end you need a colormap cmap and a normalization norm in order to map values to colors, cmap(norm(val)). For each shape one may than set the Polygon's color to the respective color from the dictionary, in this case cmap(norm(dict1[info['ID_2']])).

Inside the PatchCollection the match_original=True needs to be set to keep the colors from the original polygons.

At the end it may be useful to produce a colormap from the colormap and the normalization.

import matplotlib.pyplot as plt
from mpl_toolkits.basemap import Basemap
from matplotlib.patches import Polygon
from matplotlib.collections import PatchCollection
import numpy as np

fig= plt.figure()
ax= fig.add_subplot(111)
m=Basemap(projection='cyl',llcrnrlat=34.5,llcrnrlon=19,
                           urcrnrlat=42,urcrnrlon=28.5,resolution='h')
m.drawmapboundary(fill_color='aqua')
m.fillcontinents(color='w',lake_color='aqua')
m.drawcoastlines()
m.readshapefile('data/nomoi/nomoi','nomoi')

dict1={14464: 1.16, 14465: 1.35, 14466: 1.28, 14467: 1.69, 14468: 1.81, 14418: 1.38}
colvals = dict1.values()

cmap=plt.cm.RdYlBu
norm=plt.Normalize(min(colvals),max(colvals))

patches   = []

for info, shape in zip(m.nomoi_info, m.nomoi):
    if info['ID_2'] in list(dict1.keys()):
        color=cmap(norm(dict1[info['ID_2']]))
        patches.append( Polygon(np.array(shape), True, color=color) )

pc = PatchCollection(patches, match_original=True, edgecolor='k', linewidths=1., zorder=2)
ax.add_collection(pc)

#colorbar
sm = plt.cm.ScalarMappable(cmap=cmap, norm=norm)
sm.set_array(colvals)
fig.colorbar(sm, ax=ax)

plt.show()

enter image description here

Keverne answered 30/1, 2018 at 13:20 Comment(0)

© 2022 - 2024 — McMap. All rights reserved.