Recode summery/overview of levels before and after recoding
Asked Answered
E

4

5

I have dplyr::recode some factors and I am looking for a clean way to make LaTeX table where new and old categories, i.e. levels, are compared.

Here's an illustration of the issues using cyl from `mtcars. First some packages,

# install.packages("tidyverse", "stargazer","reporttools") 
library(tidyverse) 

and the data I intend to use,

mcr <- mtcars %>% select(cyl) %>% as_tibble() 
mcr %>% print(n=5)
#> # A tibble: 32 x 1
#>     cyl
#> * <dbl>
#> 1  6.00
#> 2  6.00
#> 3  4.00
#> 4  6.00
#> 5  8.00
#> # ... with 27 more rows

Now, I create two new factor, one with 3 categories, cyl_3col, and one with two, cyl_is_red, i.e.:

mcr_col <- mcr %>% as_tibble() %>%
    mutate(cyl_3col = factor(cyl, levels = c(4, 6, 8),labels = c("red", "blue", "green")),
           cyl_is_red = recode(cyl_3col, .default = 'is not red', 'red' = 'is red'))
mcr_col  %>% print(n=5)
#> # A tibble: 32 x 3
#>     cyl cyl_3col cyl_is_red
#>   <dbl> <fct>    <fct>     
#> 1  6.00 blue     is not red
#> 2  6.00 blue     is not red
#> 3  4.00 red      is red    
#> 4  6.00 blue     is not red
#> 5  8.00 green    is not red
#> # ... with 27 more rows

Now, I would like to show how the categories in cyl_3col and cyl_is_red are related.

Maybe something like this is better,

#> cyl_is_red  cyl_3col 
#> is red               
#>             red      
#> is not red           
#>             blue     
#>             green    

possible something like this, I imagine the is not red category spanning two rows with \multirow{} or something like it.

#>  cyl_3col   cyl_is_red
#> 1 red       is red    
#> 2 blue      is not red
#> 3 green     ----------

using or possibly some other TeX tool. I am very open as to how I can best show the recoding. I assume there's some smart way to code this thought out by someone who came before me?

I've used something like mcr_col %>% count(cyl_3col, cyl_is_red) for now, but I don't think it's really working.

Enormous answered 26/2, 2018 at 12:40 Comment(2)
Expected output is not very clear. Maybe use "\n", then use knitr::kable(x, format = "latex")Nehemiah
@zx8754, thank you for your feedback. I added another output. I think the expected output might be a bit vague as I am not sure what the bst option is. I thought others might have experience in this and could chime in with whatever they might have.Enormous
F
2

pixiedust has a merge option.

---
title: "Untitled"
output: pdf_document
header-includes: 
- \usepackage{amssymb} 
- \usepackage{arydshln} 
- \usepackage{caption} 
- \usepackage{graphicx} 
- \usepackage{hhline} 
- \usepackage{longtable} 
- \usepackage{multirow} 
- \usepackage[dvipsnames,table]{xcolor} 
---

```{r}
library(pixiedust)
library(dplyr)

mcr <- mtcars %>% select(cyl) %>% as_tibble() 
mcr_col <- mcr %>% as_tibble() %>%
  mutate(cyl_3col = factor(cyl, levels = c(4, 6, 8),labels = c("red", "blue", "green")),
         cyl_is_red = recode(cyl_3col, .default = 'is not red', 'red' = 'is red'))

mcr_col %>% 
  count(cyl_3col, cyl_is_red) %>% 
  select(-n) %>% 
  dust(float = FALSE) %>% 
  sprinkle(cols = "cyl_is_red",
           rows = 2:3,
           merge = TRUE) %>% 
  sprinkle(sanitize = TRUE,
           part = "head")
```

enter image description here

Fishbowl answered 26/2, 2018 at 12:50 Comment(1)
Thanks. Your answer is a great solution for my example data in the question. Maybe I should have made my motivation a bit clearer. The reason I am looking for this is that I have a lot of different categories that are changing, in different ways. This specific solution would require customization for each time I use it, but it does answer my question. Thanks.Enormous
L
2

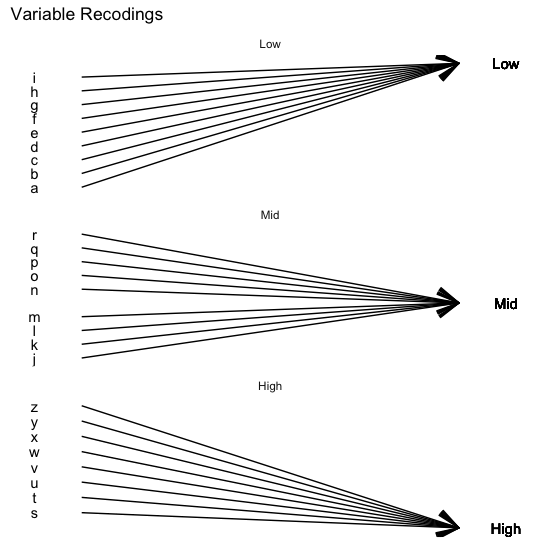
Maybe a somewhat different way of tackling the problem would be to display the recodings as a plot rather than a table -- in this way circumventing generating latex syntax. You could do something like:

# Here I make some data with lots of levels
tdf <- data.frame(cat1 = factor(letters), 
                  cat2 = factor(c(rep("Low", 9), rep("Mid", 9), rep("High", 8))))
# We'll collapse the alphabet down to three factors
tdf$cat2 <- factor(tdf$cat2, levels(tdf$cat2)[c(2,3,1)])

# Now plot it as arrows running from the first encoding to the second
ggplot2::ggplot(tdf) + 
  geom_segment(data=tdf, aes(x=.05, xend = .45, y = cat1, yend = cat2), arrow = arrow()) + 
  geom_text(aes(x=0, y=cat1, label=cat1)) + 
  geom_text(aes(x=.5, y=cat2, label=cat2))+ 
  facet_wrap(~cat2, nrow = 3, scales = "free_y") + 
  theme_classic()+
  theme(axis.title.x=element_blank(),
        axis.text.x=element_blank(),
        axis.ticks.x=element_blank(),
        axis.title.y=element_blank(),
        axis.text.y=element_blank(),
        axis.ticks.y=element_blank(),
        axis.line = element_blank(),
        strip.background = element_blank(),
        strip.text.y = element_blank()) +
  ggtitle("Variable Recodings")

enter image description here

With lots of variables this might be easier on the reader's eyes.

Linden answered 1/3, 2018 at 22:14 Comment(0)
N
2

If HTML works for you instead of latex, then you might find many options with the library tableHTML

here is an example of something you can do with it:

library(tableHTML)

connections <- mcr_col %>% 
  count(cyl_3col, cyl_is_red) 


groups <- connections %>% 
  group_by(cyl_is_red) %>% 
  summarise(cnt = length(cyl_3col))


tableHTML(connections %>% 
            select(-n, -cyl_is_red), 
          rownames = FALSE,
          row_groups = list(groups$cnt, groups$cyl_is_red))
Novia answered 5/3, 2018 at 13:52 Comment(1)
I appreciate your answer, I do however need it as LaTeX.Enormous
H
1

I'm still not sure how you want this to generalize, but assuming there's a column (such as cyl) that you want to exclude from this analysis of the recodings, how about

> mcr_col  %>% select(-cyl) %>% distinct
# A tibble: 3 x 2
  cyl_3col cyl_is_red
  <fct>    <fct>     
1 blue     is not red
2 red      is red    
3 green    is not red

This gives you a table of distinct outputs where the only column you need to specify is the one (maybe a response) that you want to exclude.

Housewarming answered 28/2, 2018 at 15:37 Comment(0)

© 2022 - 2024 — McMap. All rights reserved.