Change plotting order of categories of data in tmap map R
Asked Answered
P

1

5

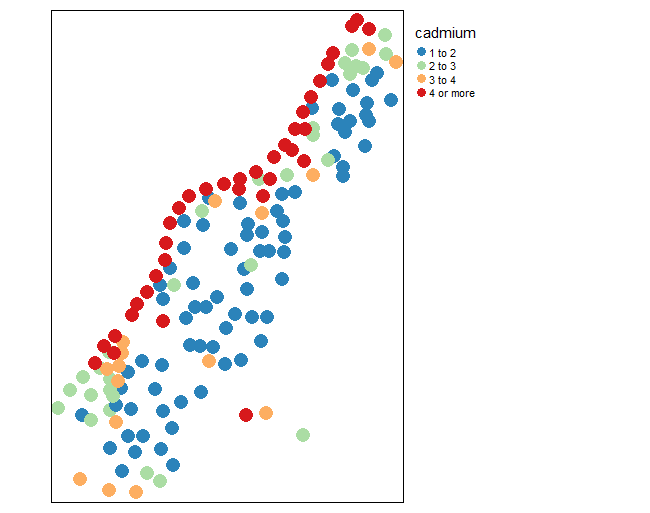
I am plotting some spatial data in R using the tmap package. I define breaks and plot color in the tm_dots function. I'd like to be able to define the plot order of the categories so that they are defined by the category (highest category on top, second highest below that, etc.). I need to be able to see clearly where the highest category points are. I know this could be achieved with multiple spatial point data frames, but is there another less clunky way? Below is an example using the meuse data. I make the points huge so they overlap. So ideally here in the plot the plot order would be: blue, green, orange, red.

libary(tmap)
library(sp)

data("meuse")

coordinates(meuse) <- c("x","y")

tm_layout() +
  tm_shape(meuse) + tm_dots("cadmium", breaks = c(1,2,3,4,Inf), palette = "-Spectral", auto.palette.mapping = FALSE,
                            size = 1) + 
  tm_legend(legend.outside = TRUE)

enter image description here

Pejsach answered 15/5, 2018 at 20:45 Comment(0)
P
7

Turns out the default plot order is the original data frame row order. To make the categories plot in the correct order, I create a numeric factor variable for the categories and sort the original data frame by it.

libary(tmap)
library(sp)
library(dplyr)

data("meuse")

meuse <- meuse %>% 
         mutate(cat = base::cut(cadmium, breaks = c(-Inf,1,2,3,4,Inf), 
                         labels = c(1,2,3,4,5))) %>% 
         arrange(cat)

coordinates(meuse) <- c("x","y")

tm_layout() +
  tm_shape(meuse) + tm_dots("cadmium", breaks = c(1,2,3,4,Inf), palette = "-Spectral", auto.palette.mapping = FALSE,
                            size = 1) + 
  tm_legend(legend.outside = TRUE)
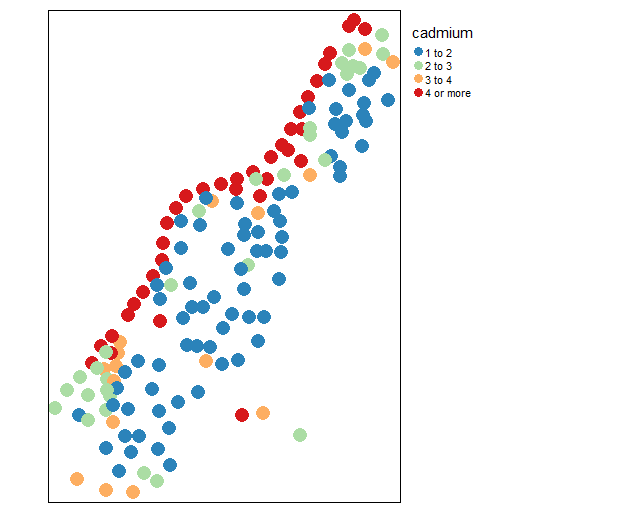
enter image description here

Pejsach answered 16/5, 2018 at 0:17 Comment(0)

© 2022 - 2024 — McMap. All rights reserved.