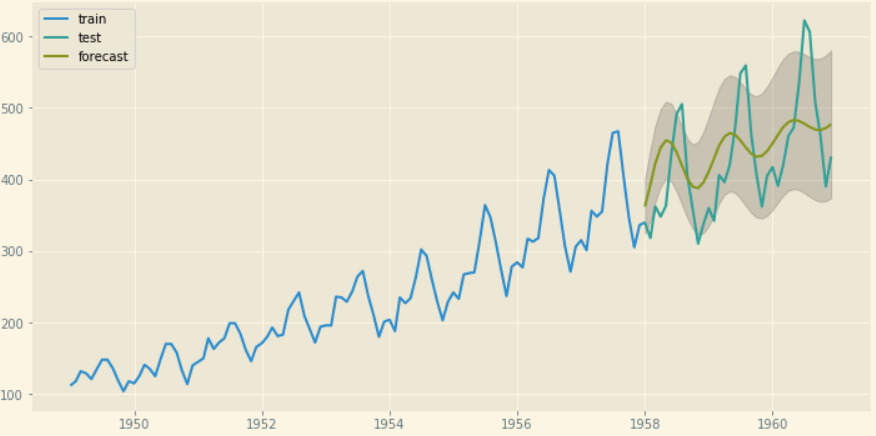
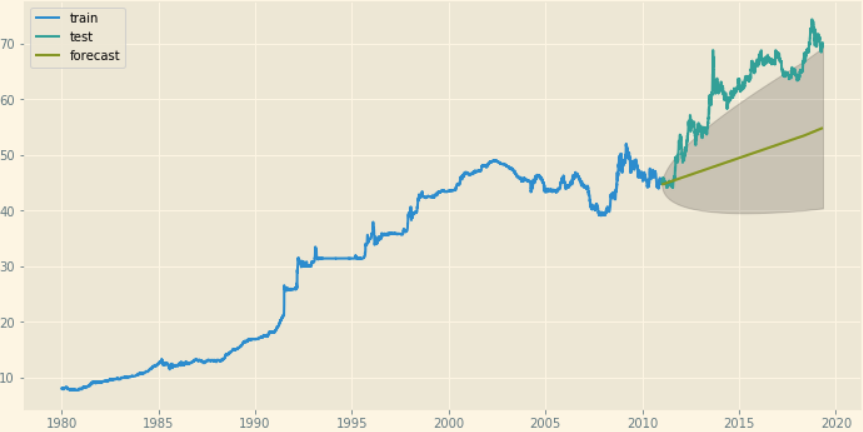
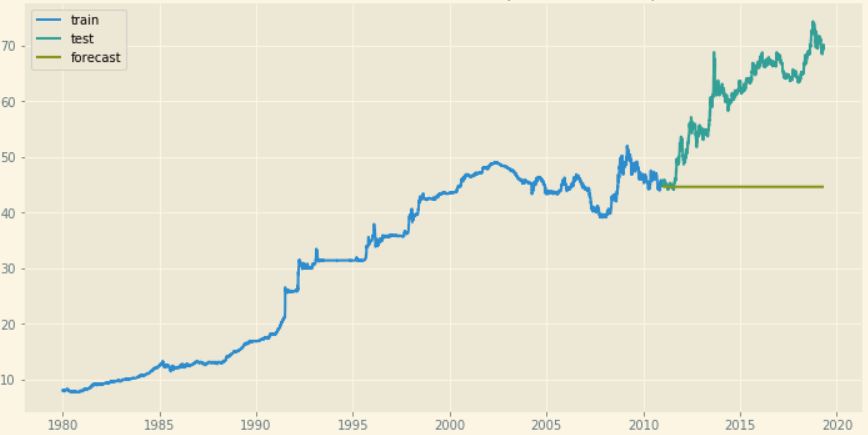
Having gone through similar issue recently, I would recommend the following:
Visualize seasonal decomposition of the data to make sure that the seasonality exists in your data. Please make sure that the dataframe has frequency component in it. You can enforce frequency in pandas dataframe with the following :
dh = df.asfreq('W') #for weekly resampled data and fillnas with appropriate method
Here is a sample code to do seasonal decomposition:
import statsmodels.api as sm

decomposition = sm.tsa.seasonal_decompose(dh['value'], model='additive',
                            extrapolate_trend='freq') #additive or multiplicative is data specific
fig = decomposition.plot()
plt.show()
The plot will show whether seasonality exists in your data. Please feel free to go through this amazing document regarding seasonal decomposition. Decomposition
- If you're sure that the seasonal component of the model is 30, then you should be able to get a good result with
pmdarima package. The package is extremely effective in finding optimal pdq values for your model. Here is the link to it: pmdarima
example code pmdarima
If you're unsure about seasonality, please consult with a domain expert about the seasonal effects of your data or try experimenting with different seasonal components in your model and estimate the error.
Please make sure that the stationarity of data is checked by Dickey-Fuller test before training the model. pmdarima supports finding d component with the following:
from pmdarima.arima import ndiffs
kpss_diff = ndiffs(dh['value'].values, alpha=0.05, test='kpss', max_d=12)
adf_diff = ndiffs(dh['value'].values, alpha=0.05, test='adf', max_d=12)
n_diffs = max(adf_diff , kpss_diff )
You may also find d with the help of the document I provided here. If the answer isn't helpful, please provide the data source for exchange rate. I will try to explain the process flow with a sample code.


