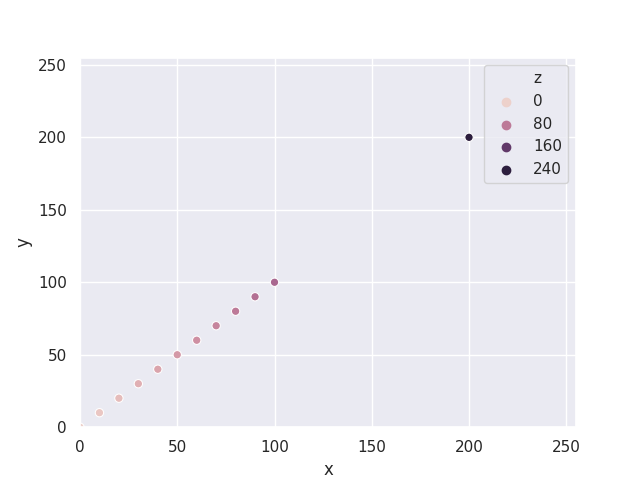
I'm trying to use seaborn to create a colored bubbleplot of 3-D points (x,y,z), each coordinate being an integer in range [0,255]. I want the axes to represent x and y, and the hue color and size of the scatter bubbles to represent the z-coordinate.
The code:
import seaborn
seaborn.set()
import pandas
import matplotlib.pyplot

x               = [0, 10, 20, 30, 40, 50, 60, 70, 80, 90, 100, 200]
y               = [0, 10, 20, 30, 40, 50, 60, 70, 80, 90, 100, 200]
z               = [0, 10, 20, 30, 40, 50, 60, 70, 80, 90, 100, 200]

df = pandas.DataFrame(list(zip(x, y, z)), columns =['x', 'y', 'z'])

ax = seaborn.scatterplot(x="x", y="y",
                 hue="z",
                 data=df)

matplotlib.pyplot.xlim(0,255)
matplotlib.pyplot.ylim(0,255)
matplotlib.pyplot.show()
gets me pretty much what I want:
This however makes the hue range be based on the data in z. I instead want to set the range according to the range of the min and max z values (as 0,255), and then let the color of the actual points map onto that range accordingly (so if a point has z-value 50, then that should be mapped onto the color represented by the value 50 in the range [0,255]).
My summarized question:
- How to manually set the hue color range of a numerical variable in a scatterplot using seaborn?
I've looked thoroughly online on many tutorials and forums, but have not found an answer. I'm not sure I've used the right terminology. I hope my message got across.


seaborn.scatterplot(...., hue_norm=(0,255), ...). To avoid confusion, it's best leave out thesizes=when there isn't asize=parameter. – Welcherhue="z"???hue="z"means to use the z-values to determine the color.hue_norm=(0,255)is meant to givez==0the lightest color andz==255the darkest color. – Welcher