Can there be overlap in k-means clusters?
Asked Answered
E

2

5

I am unclear about why k-means clustering can have overlap in clusters. From Chen (2018) I saw the following definition:

"..let the observations be a sample set to be partitioned into K disjoint clusters"

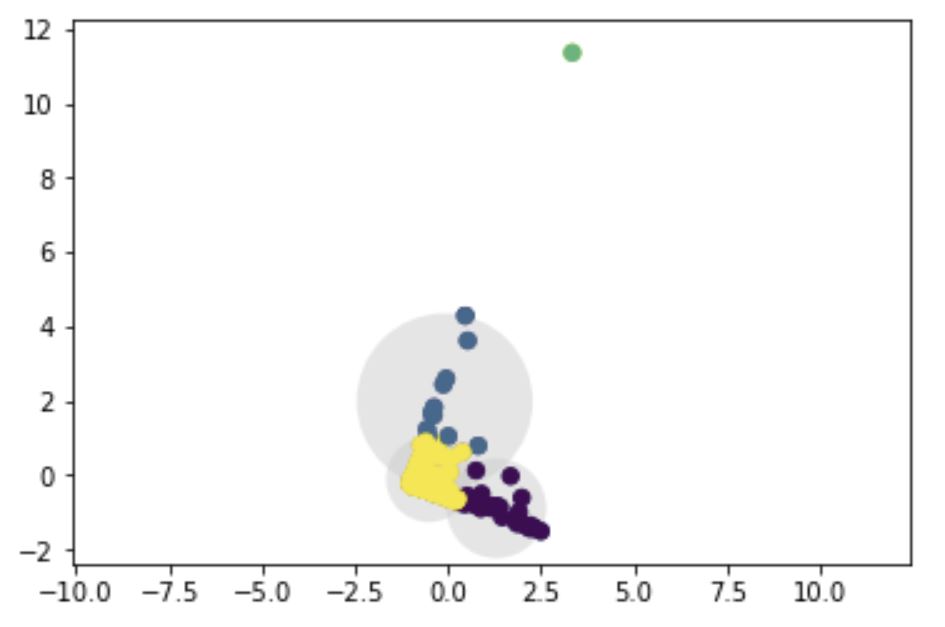
However I see an overlap in my plots, and am not sure why this is the case.

For reference, I am trying to cluster a multi-dimensional dataset with three variables (Recency, Frequency, Revenue). To visualize clustering, I can project 3D data into 2D using PCA and run k-means on that. Below is the code and plot I get:

df1=tx_user[["Recency","Frequency","Revenue"]]
#standardize
names = df1.columns
# Create the Scaler object
scaler = preprocessing.StandardScaler()
# Fit your data on the scaler object
scaled_df1 = scaler.fit_transform(df1)
df1 = pd.DataFrame(scaled_df1, columns=names)
df1.head()
del scaled_df1

sklearn_pca = PCA(n_components = 2)
X1 = sklearn_pca.fit_transform(df1)
X1 = X1[:, ::-1] # flip axes for better plotting
kmeans = KMeans(3, random_state=0)
labels = kmeans.fit(X1).predict(X1)
plt.scatter(X1[:, 0], X1[:, 1], c=labels, s=40, cmap='viridis');

from sklearn.cluster import KMeans
from scipy.spatial.distance import cdist

def plot_kmeans(kmeans, X, n_clusters=4, rseed=0, ax=None):
    labels = kmeans.fit_predict(X)

    # plot the input data
    ax = ax or plt.gca()
    ax.axis('equal')
    #ax.set_ylim(-5000,7000)
    ax.scatter(X[:, 0], X[:, 1], c=labels, s=40, cmap='viridis', zorder=2)

    # plot the representation of the KMeans model
    centers = kmeans.cluster_centers_
    radii = [cdist(X[labels == i], [center]).max()
             for i, center in enumerate(centers)]
    for c, r in zip(centers, radii):
        ax.add_patch(plt.Circle(c, r, fc='#CCCCCC', lw=3, alpha=0.5, zorder=1))

kmeans = KMeans(n_clusters=4, random_state=0)
plot_kmeans(kmeans, X1)

k-means plot

My question is: 1. Why is there an overlap? Is my clustering wrong if there is? 2. How does k-means decide cluster assignment incase there is an overlap?

Thank you

Reference: Chen, L., Xu, Z., Wang, H., & Liu, S. (2018). An ordered clustering algorithm based on K-means and the PROMETHEE method. International Journal of Machine Learning and Cybernetics, 9(6), 917-926.

Elburr answered 29/3, 2020 at 11:15 Comment(2)
by definition of k-means algorithm clusters are disjointSyllabism
I see, I will update the question. Any idea why I am getting an overlap in my plots?Elburr
S
5

K-means computes k clusters by average approximation. Each cluster is defined by their computed center and thus is unique by definition.

Sample assignment is made to cluster with closest distance from cluster center, also unique by definition. Thus in this sense there is NO OVERLAP.

However for given distance d>0 a sample may be within d-distance to more than one cluster center (it is possible). This is what you see when you say overlap. However still the sample is assigned to closest cluster not to all of them. So no overlap.

NOTE: In the case where a sample has exactly same closest distance to more than one cluster center any random assignment can be made between the closest clusters and this changes nothing important in the algorithm or results since clusters are re-computed after assignment.

Syllabism answered 29/3, 2020 at 11:27 Comment(0)
B
2

Kmeans algorithm is an iterative algorithm that tries to partition the dataset into K-pre-defined distinct non-overlapping subgroups (clusters) where each data point belongs to only one group. It tries to make the inter-cluster data points as similar as possible while also keeping the clusters as different (far) as possible. It assigns data points to a cluster such that the sum of the squared distance between the data points and the cluster’s centroid (arithmetic mean of all the data points that belong to that cluster) is at the minimum. The less variation we have within clusters, the more homogeneous (similar) the data points are within the same cluster.

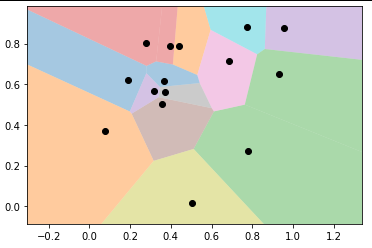
Perhaps you did something wrong... I don't have your data, so I can't test it. You can add boundaries, and check those. See the sample code below.

import numpy as np
import matplotlib.pyplot as plt
from scipy.spatial import Voronoi

def voronoi_finite_polygons_2d(vor, radius=None):
    """
    Reconstruct infinite voronoi regions in a 2D diagram to finite
    regions.

    Parameters
    ----------
    vor : Voronoi
        Input diagram
    radius : float, optional
        Distance to 'points at infinity'.

    Returns
    -------
    regions : list of tuples
        Indices of vertices in each revised Voronoi regions.
    vertices : list of tuples
        Coordinates for revised Voronoi vertices. Same as coordinates
        of input vertices, with 'points at infinity' appended to the
        end.

    """

    if vor.points.shape[1] != 2:
        raise ValueError("Requires 2D input")

    new_regions = []
    new_vertices = vor.vertices.tolist()

    center = vor.points.mean(axis=0)
    if radius is None:
        radius = vor.points.ptp().max()*2

    # Construct a map containing all ridges for a given point
    all_ridges = {}
    for (p1, p2), (v1, v2) in zip(vor.ridge_points, vor.ridge_vertices):
        all_ridges.setdefault(p1, []).append((p2, v1, v2))
        all_ridges.setdefault(p2, []).append((p1, v1, v2))

    # Reconstruct infinite regions
    for p1, region in enumerate(vor.point_region):
        vertices = vor.regions[region]

        if all([v >= 0 for v in vertices]):
            # finite region
            new_regions.append(vertices)
            continue

        # reconstruct a non-finite region
        ridges = all_ridges[p1]
        new_region = [v for v in vertices if v >= 0]

        for p2, v1, v2 in ridges:
            if v2 < 0:
                v1, v2 = v2, v1
            if v1 >= 0:
                # finite ridge: already in the region
                continue

            # Compute the missing endpoint of an infinite ridge

            t = vor.points[p2] - vor.points[p1] # tangent
            t /= np.linalg.norm(t)
            n = np.array([-t[1], t[0]])  # normal

            midpoint = vor.points[[p1, p2]].mean(axis=0)
            direction = np.sign(np.dot(midpoint - center, n)) * n
            far_point = vor.vertices[v2] + direction * radius

            new_region.append(len(new_vertices))
            new_vertices.append(far_point.tolist())

        # sort region counterclockwise
        vs = np.asarray([new_vertices[v] for v in new_region])
        c = vs.mean(axis=0)
        angles = np.arctan2(vs[:,1] - c[1], vs[:,0] - c[0])
        new_region = np.array(new_region)[np.argsort(angles)]

        # finish
        new_regions.append(new_region.tolist())

    return new_regions, np.asarray(new_vertices)

# make up data points
np.random.seed(1234)
points = np.random.rand(15, 2)

# compute Voronoi tesselation
vor = Voronoi(points)

# plot
regions, vertices = voronoi_finite_polygons_2d(vor)
print("--")
print(regions)
print("--")
print(vertices)

# colorize
for region in regions:
    polygon = vertices[region]
    plt.fill(*zip(*polygon), alpha=0.4)

plt.plot(points[:,0], points[:,1], 'ko')
plt.axis('equal')
plt.xlim(vor.min_bound[0] - 0.1, vor.max_bound[0] + 0.1)
plt.ylim(vor.min_bound[1] - 0.1, vor.max_bound[1] + 0.1)

enter image description here

Great resource here.

https://scikit-learn.org/stable/auto_examples/cluster/plot_kmeans_digits.html

Bedazzle answered 1/4, 2020 at 0:16 Comment(1)
In my visualization the radius of the circle is defined by the distance between centroid and the furthest point in the clusterElburr

© 2022 - 2024 — McMap. All rights reserved.