I have the following data:
Date
2020-07-20   -98.109956
2020-07-21   -94.408946
2020-07-22   -76.788330
2020-07-23   -71.094908
2020-07-24   -92.262792
2020-07-27   -97.932848
2020-07-28   -90.236719
2020-07-29   -96.301774
2020-07-30   -94.293501
2020-07-31   -98.110483
2020-08-03   -99.121514
2020-08-04   -73.715980
2020-08-05   -67.069465
2020-08-06   -57.401802
2020-08-07   -53.323235
2020-08-10   -50.000000
2020-08-11   -24.169180
2020-08-12   -10.286685
2020-08-13    -6.745360
2020-08-14   -19.178088
2020-08-17    -2.475911
2020-08-18   -11.586069
2020-08-19    -4.896705
2020-08-20   -10.435387
2020-08-21   -20.938373
2020-08-24    -8.269516
2020-08-25   -11.557382
2020-08-26    -2.938893
2020-08-27   -10.296292
2020-08-28    -7.050787
2020-08-31   -24.016059
2020-09-01   -27.694853
2020-09-02    -4.538226
2020-09-03    -8.166541
2020-09-04    -8.243151
2020-09-07    -3.356906
2020-09-08   -32.970033
2020-09-09   -11.716626
2020-09-10   -16.220030
2020-09-11   -33.078070
2020-09-14   -38.897395
2020-09-15   -35.068910
2020-09-16   -39.969342
2020-09-17   -23.889707
2020-09-18   -26.339946
2020-09-21   -68.164790
2020-09-22   -89.451473
2020-09-23   -72.038817
2020-09-24   -74.854345
2020-09-25   -61.359206
Name: CHAMTEMP, dtype: float64
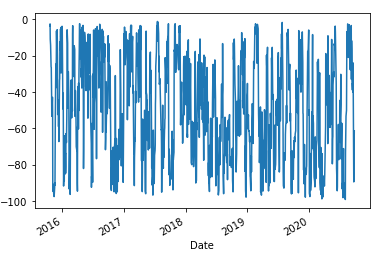
The plot looks like this:
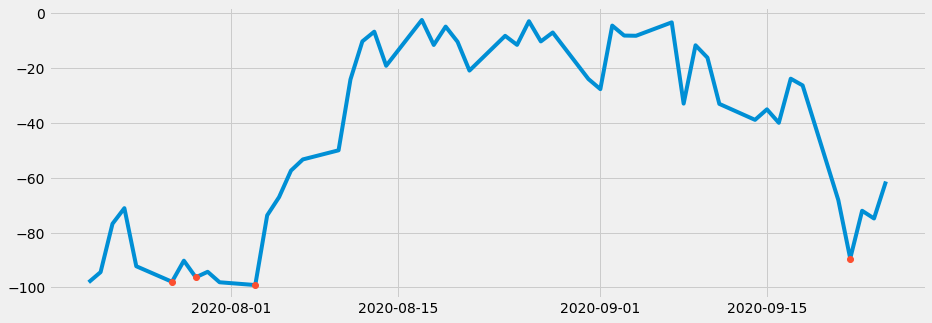
I am trying to find all the local min values by looking for data which is at least -80 and continues to give lower values until it gives a higher values.
For example: if the values are -80, -82, -83, -90, -89. In this example -90 would be the lowest value because -89 was higher than -90.
I tried this but i am getting an error:
data.loc[data < -80] and data.loc[data.shift(-1)<data.shift(0)]

ValueError: The truth value of a Series is ambiguous. Use a.empty, a.bool(), a.item(), a.any() or a.all().
How can i resolve this error?


